Blog

Permutation Test for matlab

This is taken and copied from github/behinger/permtest:
I couldn’t find a simple permutation test for matlab, thus I decided to implement it on my own. I got inspired by the “statmod”-R package and followed Phipson & Smyth 2010’s recommendations.

How to Use:

[code lang=matlab] permtest(randi([1,5],100),randi([3,8],100))
permtest(randi([1,5],100),randi([3,8],100),10000)
permtest(randi([1,5],100),randi([3,8],100),[],\"conservative\") % usually the fastest implementation
[/code]

Permutations / Randomization

I chose to do permutations with repeats. This complicates p-values, but in the end I found it to be faster (and scales better).

P-Values

There are three methods implemented to get the p-value:

b = permutations with greater value than test-statistic

m_t = number of possible permutations

P-values of complete permutations cannot be exactly 0, because the original permutation is included in the set of permutations, thus the minimal p-value has to be 1/nPerm. This first formula makes sure of that and is most commonly used. If you use an implementation that does not allow for repeated permutations, you can stick with this one (but thats not my implementation ;)).

method = ‘conservative’
$$p_u = p_t =\frac{ b+1}{nPerm+1}$$

method = ‘exact’
$$p_e = 1/(m+1) + \sum_{p=1/m_t}^{1}(binocdf(b,nperm,p))$$

method = ‘approximate’
$$p_e \approx p_a = p_u – \int_{p=0}^{0.5/(m_t+1)}(binocdf(b,nperm,p))$$

It is true that $p_u >p_e$ (see Phipson & Smyth 2010).

Checks

  • I can repeat Figure 1 from Phipson & Smyth 2010
  • I get a flat histogram for two null effects
  • I get 5% false positives at alpha=0.05

Future Implementation

  • Add custom – function ability to select your own test-statistic (now its simply mean between groups). e.g. t-stat
  • Add non-repeated permutations
  • Parallelize calculations similar to the statmod-R implementation. This allows for many tests to be calculated at the same time. I recommend to use the “GaussQuad.m” function from matlab to do it (have a look at the perm function from statmod).

Dummy coding and Effects coding

A small fact got me into trouble (spoiler: the intercept in effects coding represents the mean of conditions, not the data-mean).

Update 2016-08-11

I found a nice paper that remedies the last point: weighted effects coding

Update 2018-11-30

If you enjoyed reading this post, check out my sucessor post on Effect/Sum Coding

Update 2019-07-22

I highly recommend this recent paper: How to capitalize on a priori contrasts in linear (mixed) models: A tutorial (2019) which will explain all things of this blogpost in more space, more examples, more code and with better words!

The goal

We try to model two factors with two levels using a linear model. We therefore need a schema to model categorical variables as if they were continuous variables.

2×2 “ANOVA”

To start, we have take a typical 2×2 ANOVA design. It is balanced (each ‘cell’ has equal number of data points) and homoskedastic (equal variance in each cell).
dummy_effects_coding-07

As you see here, there are two Factors, A and B, with two levels each. For example A could be “Drives a Car”, and B could be “Owns a Suit”. The dependent variable, which we try to explain, could be “Total Money”. Alternatively in Cognitive-Neuroscience, A could be “Drank coffee before experiment” and B could be “Slept before experiment”, the dependent variable in that case could be “Alpha-Band-EEG-Amplitude”

The data are split up by A, and color coded by B. A in addition is shape-coded. If A is “no” as well as B, we get the smallest dependent variable, if both are “yes” we get the largest one.
dummy_effects_coding-01
I already put the linear regression model we are going to use in the image. As well as the respective means.

Main Effects

We are usually interested in the “main-effects”, which are depicted in the next picture.
dummy_effects_coding-06
How much does the dependent variable change, if we move from A “no” to A “yes”. In this case the main effect of A is 30, and of B is 40.

This categorical main effects can be estimated by linear regression. Because naively linear regression only works for continuous variables, we need a way to describe the categorical variables as continuos variables. In principle we want to fit the red and cyan line depicted in the plots. There are two often used methods to solve this with linear model coding. Dummy Coding and Effects Coding.

Dummy Coding

Let’s start with Dummy Coding. We simply set the first level (‘no’) to 0, and the (‘yes’) to 1. That is, we think of it as a continuous variable which has data only at two distinct values and code it as $X_A$.
Thus for each factor we get one slope which we call $\beta_A$ and $\beta_B$ but in addition we could have an interaction, thus we code this as well. The interaction is simply the multiplication of the two main Factors, thus it is coded with 1, only if A and B are both 1 as well ($\beta_{AB}$).
We estimated the betas (see following image).

How do we interprete the coefficients?
dummy_effects_coding-02
From the image it should become clear, that with dummy coding we are estimating the location of the cell-means. In order to calculate the main effects we would need some additional calculations.

Effects Coding

For effects coding we set the ‘no’ to -1 (or -0.5 if you prefer) and the ‘yes’ to +1 (or +0.5).
dummy_effects_coding-03
You can clearly see, that the parameter estimates are the main-effects, not the cell-means anymore. $2\cdot\beta_A $ is the main effect of A. Why $\cdot 2$? Because we coded with -1 / +1 (thus the difference e.g. the jump from -1 to 1 is 2), if we would use -0.5 / 0.5 (thus the difference is 1 as in the dummy coding above) the parameter estimate directly represents the main effects.

How do we get the cell-means from effects coding?
dummy_effects_coding-05
An example might be appropriate to better see what it means:
$$\hat{y} = \beta_0 + \beta_A X_A + \beta_B X_B + \beta_{AB} X_{AB}$$

We want to know the cell mean of B ‘yes’ if A is ‘no’. Thus $X_B = +1$ and $X_A = -1$. As written before $X_{AB}$ is the multiplication, thus $X_{AB} = X_B \cdot X_A = -1 \cdot +1 = -1$.

$${\hat{y}} = \beta_0 + \beta_A \cdot -1+ \beta_B \cdot +1 + \beta_{AB} \cdot -1$$

Intercepts

As visible in the graphs the intercepts of dummy coding represents the reference category, here the value of A=’no’ and B=’no’. The intercept of effects coding represents the mean of the conditions. This can be very different from the the total mean of the data, if you have unbalanced data:
dummy_effects_coding-04
Here the A=’yes’ and B=’yes’ condition has 2.5 times more data-points, thus it moves the total-mean upwards. But the effects did not change, thus the condition means and the mean of the condition means did not change.
It is actually qiute useful, that the effects coding intercept does not represent the total mean, but the mean of condition means.

And that’s it. When should you use which? I don’t think there is a clearcut case for one or the other. It boils down to interpretation and personal preference, but some cases it is more useful to have the one and in other the other. See for example here under “why use effects coding”.

Further reading

Effect coding versus dummy coding in analysis of data from factorial experiments
A list of different coding schemes

Lilli Kaufhold: The influence of Fixation Durations on the Initiation of Saccades

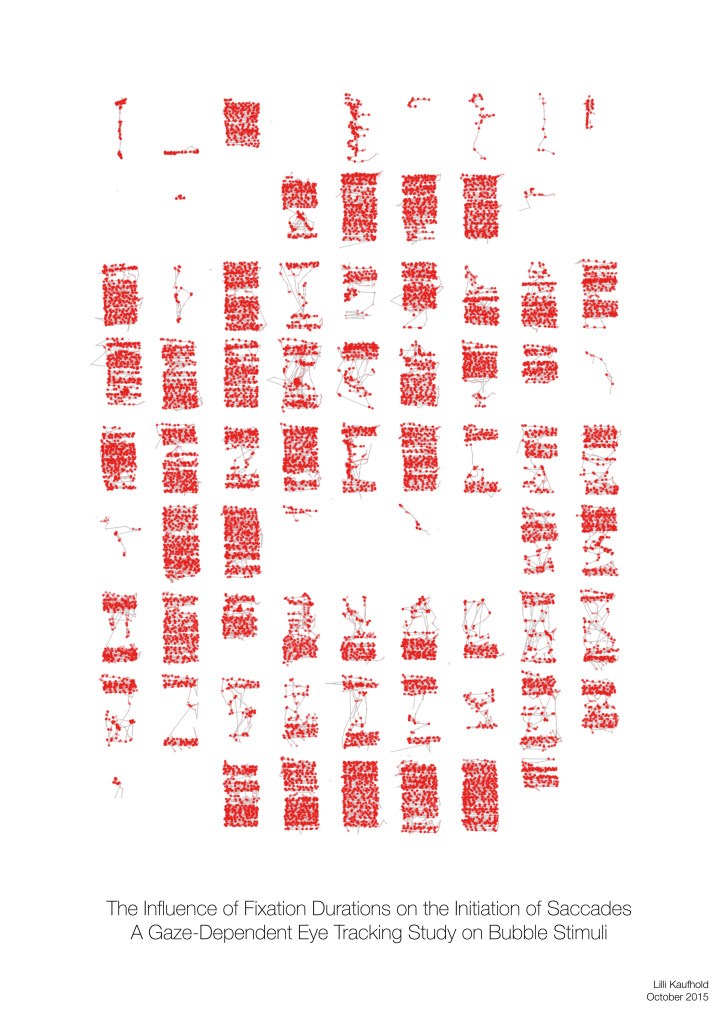
One of my Master students (Lilli Kaufhold) finished her thesis on parts of this study (manuscript forthcoming). I took the opportunity to form her work into a pice of art.

It is a meta-study of an eye-tracking study. I recorded my eye-movements while reading her thesis about eye movements(using these cool 3D-printable open source eye trackers!) . Every red dot is a fixation (a moment where the eye stayed still) and every line connects two fixations with an eye movement. It is clear that I focused on the words, but some figures elicit specific eye tracking behaviour. Of course it is up to the viewer to figure out, which page contains what content.

Lilli Kaufhold Master Thesis

The idea is to inspire discussion with persons who do not have an academic background or work in a different field. The thesis is hidden in the drawer, but the poster is out there at the wall for everyone to see.
This is the second piece, for the first one see here.

Statistics: Cluster Permutation Test

I sometimes give improvised lectures to a small circle of students. These are some of the explanations I use.

The goal

Find time-points in a time series that differ between two conditions over subjects without performing single independent tests for each time-point.

Step by Step Guide

In this tutorial, we apply the cluster-permutation test to a single time-series. This could be a single channel, an average over channels, or one “source/component” from an ICA decomposition.

We can make use of the neighbour-relation of time: $t$ has the neighbors $t-1$ and $t+1$. We don’t expect the time points to be independent, but that they have a relationship which we can exploit (for multi-channel data, we could include the neighbour-relation between channels as well, but let’s not get ahead of ourselves).

In our example we use ICA component activation because a) this was the student’s problem, b) we do not need to take into account several channels which were recorded at the same time (but we could!). Of course the algorithm is independent of the signal: We could use ERPs, Bandpass-Filtered-Frequency Amplitudes, Image-Pixel-Grayvalues or many others.

1. Extract the component activation over time

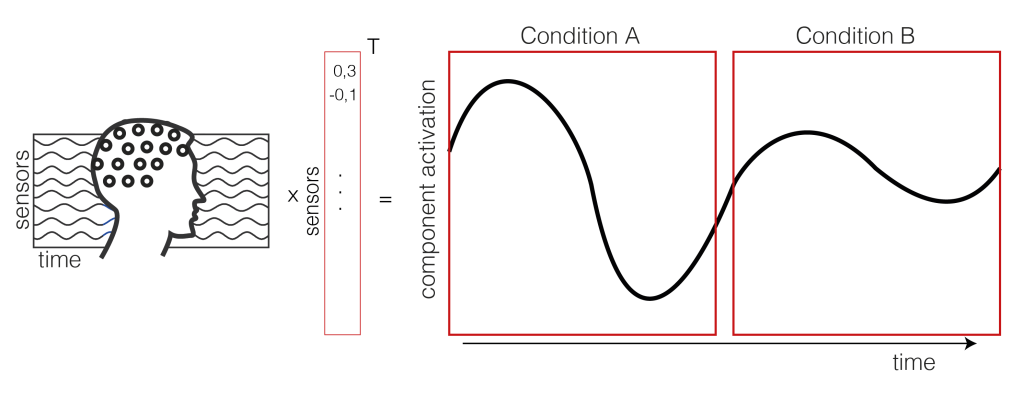
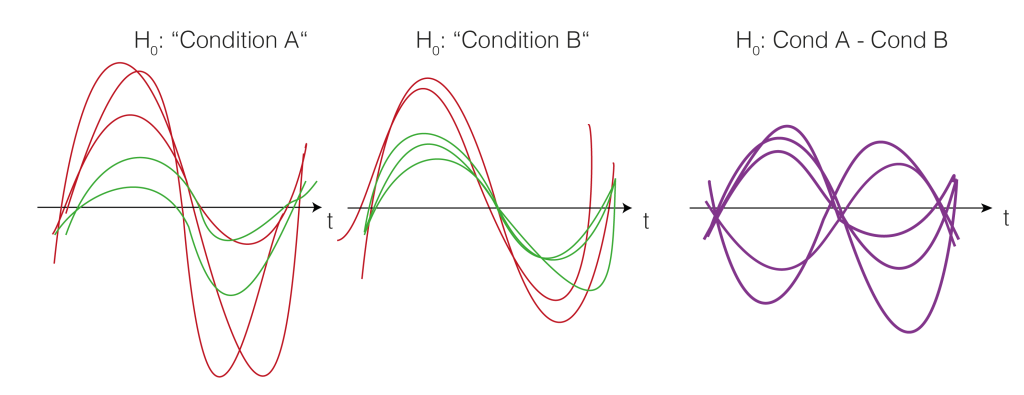
We take the EEG data (time x sensor) and multiply it with a mixing matrix (the component map we extracted through ICA). We receive a one dimensional IC activation profile over time. In our case, we have trials of two conditions (A and B) shown as a continuous signal (only one trial of each condition is shown here, usually you have more than two trials).
cluster_correction figures-01

2. Get the trials for multiple subjects

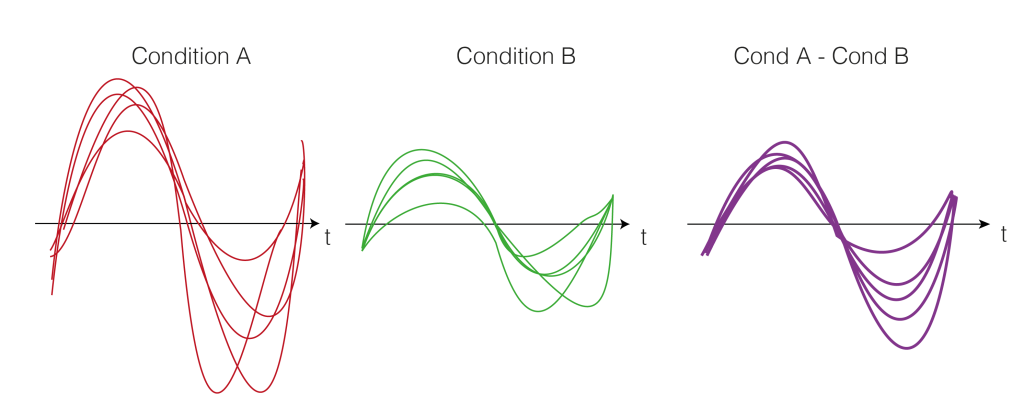
Repeat Step 1. for each subject. We calculate the difference between the two conditions A and B (a within subject comparison). Thus, we get difference values for each subject over time (purple).
cluster_correction figures_Zeichenfläche 2

3. Test-Statistics (T-Value)

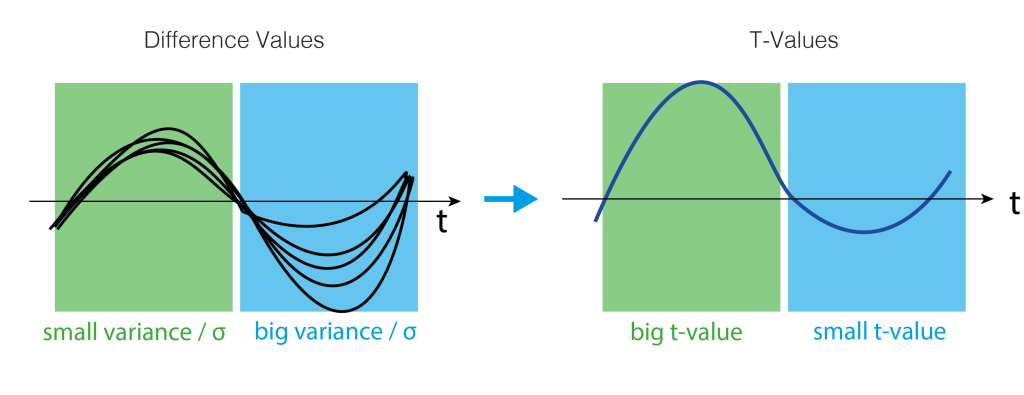
As a test statistics, we could use the mean, but we prefer the t-statistic because it punishes high variance between subjects. t-values are defined by:
$$t = \frac{\bar{x}}{\frac{\sigma}{sqrt(n)}}$$
Where $t$ is the t-value, $\bar{x}$ is the mean difference, $\sigma$ the standard deviation and $n$ the number of subjects. Intuitively, the more subjects we have or the bigger the difference (marked in blue), the bigger the t-value. The smaller the variance, the bigger the t-value (marked in green). Very colloquial: a scale-free measure of how sure we are there is an effect.
A visual help is in the next figure.
cluster_correction figures_Zeichenfläche 3

4. Clusters over time

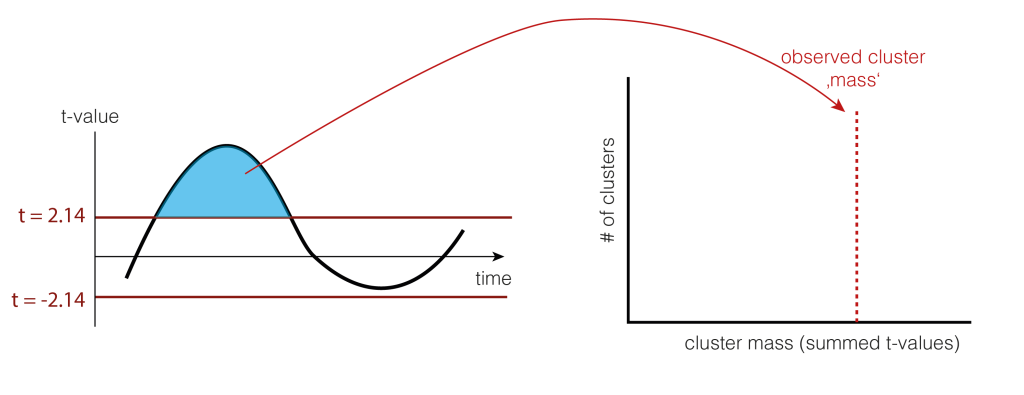
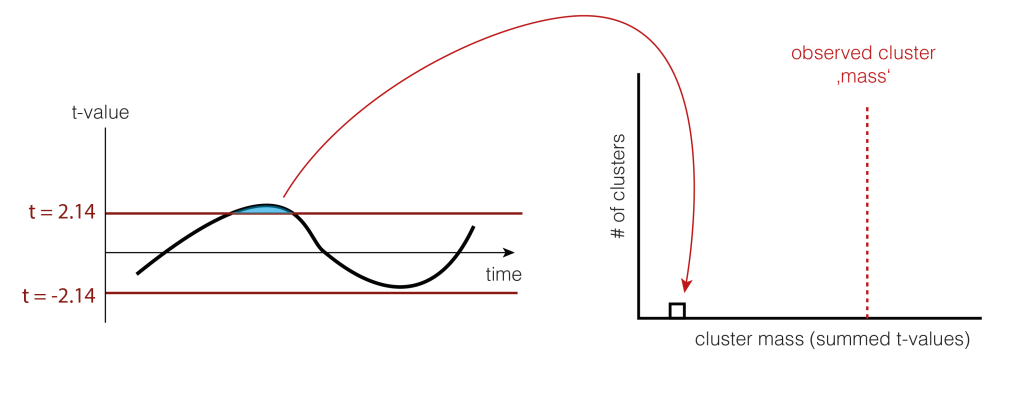
We would rather not do a statistical test for each time-point individually because we would need to correct for multiple comparison for all time points. Instead, we use a trick: Let’s define clusters by an arbitrary threshold and test whether these clusters are larger clusters that occur by chance.
The arbitrary threshold we use is at p=0.05 (which directly corresponds to two t-values when given the number of subjects, e.g. for 15 subjects the t-values corresponding to p=0.05 are 2.14 and -2.14). In our example, this leads to a single positive cluster, but of course, multiple cluster of different sizes could have formed depending on the IC activation over time.

cluster_correction figures_Zeichenfläche 3 Kopie

As a statistic, we could use the number of samples the cluster extends, the summed t-value, or many other statistics. We use cluster-mass, which is the sum of the t-values.

5. Permutation of data

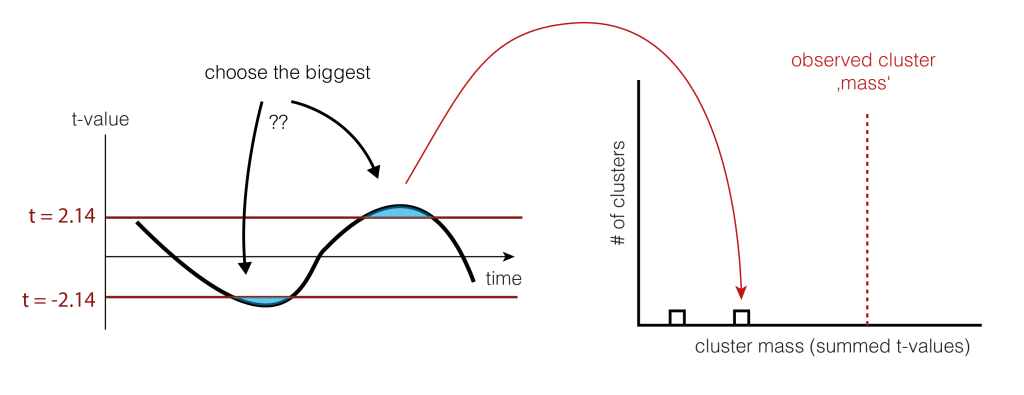
We now want to estimate how big clusters would be, if there would be no differences between the conditions A and B. This would mean that the clusters formed just by chance (this is our $H_0$ distribution of cluster sizes). To do this, we shuffle the condition-label for each subject. The idea is that if there is no difference between the conditions, the labels are meaningless and therefore shuffling them would yield similar results as before. Note that they are similar, not identical. We thus try to estimate how big the variability of these similar results are, and whether our observed value falls into the variability, or whether i is special.
cluster_correction figures_Zeichenfläche 3 Kopie 2

Note that we actually do not need to go back to the two conditions, but we could just flip (multiply by -1) randomly every subject-difference curve.

So we shuffle and calculate the cluster size.

cluster_correction figures_Zeichenfläche 6

And shuffle and calculate the cluster size(s) again (take the largest one if there are multiple)

cluster_correction figures_Zeichenfläche 7

6. Check the tail

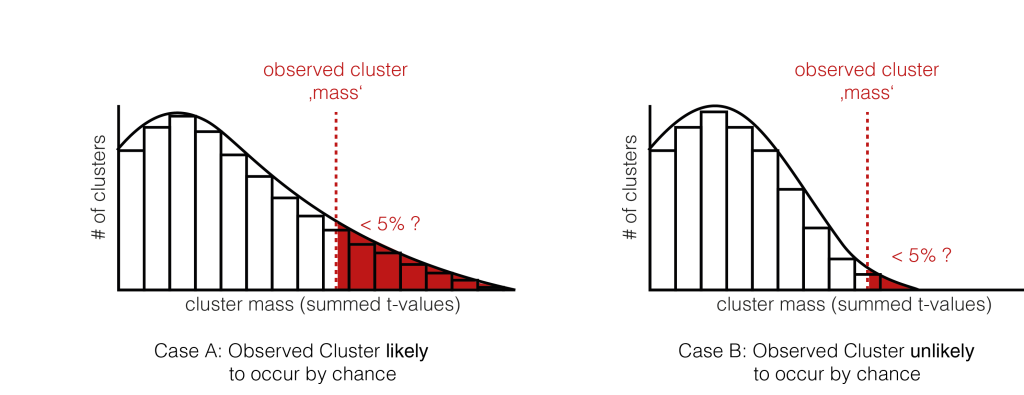
We now check whether our observed cluster mass ( Step 4.) is greater than 95% of what we would expect by chance ( Step 5. ). The exact value gives us the p-value of the cluster, the probability that cluster-mass with the observed (or more extreme) size would have occurred when there was no actually difference between the conditions. If we had initially observed multiple clusters, we can check each against the same distribution.
cluster_correction figures_Zeichenfläche 8
We have two exemplary distributions here: in the left one, we would accept the notion, that the observed cluster mass could have appeared by chance ( p > 0.05). In the second case, we would reject $H_0$, the observed cluster mass is unlikely to come from random chance alone.

And that’s how you do cluster permutation statistics.

For some references, see:
Fieldtrip Cluster Permutation Talk
Fieldtrip FAQ, read this!
Maris: Statistical testing in electrophysiological studies
Maris, Oostenveld: Nonparametric statistical testing of EEG- and MEG-data.

Thanks to Tim C Kietzmann & José Ossandon for teaching me this some (long ;)) time ago. Thanks to Silja Timm for preparing the graphics and Anna Lisa Gert for comments on the text!

Katja Häusser: Psychophysical Study on the Temporal and Nasal Visual Hemifields and the Blind Spot

One of my Bachelor students (Katja Häusser) finished her thesis on parts of this study (manuscript forthcoming). This is the first piece of art I made based on a thesis. For this one, I reconstructed the main stimulus used in the psychophysics study by the complete text of the thesis.

khaeusser_artwork

The idea is to inspire discussion with people who do not necessarily have an academic background. The thesis might be hidden in the drawer, or is incromprehensible for people outside of science, but the poster is out there at the wall for everyone to see.
I hope to start a series, where most projects end up in an unique piece of art.

Sun Grid Engine Command-Dump

Here in the institute we have a Sun Grid Engine available. It is a tool to post computing-jobs on other workspaces (we have I think up to 60 available). There are certain commands and things that I do regularly which I tend to forget after half a year, or which might be useful for orthes.

  • Show all jobs that are running on the grid
    qstat -u \* or alternativly for a single user qstat -u behinger
  • exclude a single computer/host from running a job
    qsub -l mem=5G,h=!computername.domain script.sh
    to exclude multiple hosts: h=!h4&!h5 or h=!(h4|h5) Source
    of course mem=5G is an arbitrary other requirement.
  • Run a gridjob on a single R-File
    add #!/usr/bin/Rscript in the beginning of the file, then you can simply run qsub Rscript_name.R. I had problems using qsub Rscript -e "Rscript_name.R" due to the many quotes that would need escaping (I use to call the grid using system() command in matlab/R).

Matlab winsorized mean over all dimension

This is a function I wrote back in 2014. I think it illustrates an advanced functionality in matlab that I hadn’t found written about before.

The problem:

Calculate the winsorized mean of a multidimensional matrix over an arbitrary dimension.

Winsorized Mean

The benefits of the winsorized mean can be seen here:
Unbenannt-3

We replace the top 10% and bottom 10% by the remaining most extreme value before calculating the mean (left panel). The right panel shows how the mean is influenced by a single outlier, but the winsorized mean is not (ignore the “yuen”-box”)

Current Implementation

I adapted an implementation from the LIMO toolbox based on Original Code from Prof. patrick J Bennett, McMaster University. In this code the dimension is fixed at dim = 3, the third dimension.

They solve it in three steps:

  1. sort the matrix along dimension 3
  2. [matlab] xsort=sort(x,3); [/matlab]
  3. replace the upper and lower 10% by the remaining extreme value
  4. [matlab] % number of items to winsorize and trim
    g=floor((percent/100)*n);
    wx(:,:,1:g+1)=repmat(xsort(:,:,g+1),[1 1 g+1]);
    wx(:,:,n-g:end)=repmat(xsort(:,:,n-g),[1 1 g+1]);
    [/matlab]
  5. calculate the mean over the sorted matrix
  6. [matlab]wvarx=var(wx,0,3);[/matlab]

Generalisation

To generalize this to any dimension I have seen two previous solution that feels unsatisfied:
– Implement it for up to X dimension hardcoded and then use a switch-case to get the solution for the case.
– use permute to reorder the array and then go for the first dimension (which can be slow depending on the array)

Let’s solve it for X = 20 x 10 x 5 x 2 over the third dimension
[matlab]

function [x] = winMean(x,dim,percent)
% x = matrix of arbitrary dimension
% dim = dimension to calculate the winsorized mean over
% percent = default 20, how strong to winsorize

% How long is the matrix in our required dimension
n=size(x,dim);
% number of items to winsorize and trim
g=floor((percent/100)*n);
x=sort(x,dim);

[/matlab] up to here it my and the original version are very similar. The hardest part is to generalize the part, where the entries are overwritten without doing it in a loop.
We are now using the subsasgn command and subsref
We need to generate a structure that mimics the syntax of
[matlab] x(:,:,1:g+1,:) = y [/matlab] for arbitrary dimensions and we need to construct y

[matlab] % Prepare Structs
Srep.type = ‘()’;
S.type = ‘()’;

% replace the left hand side
nDim = length(size(x));

beforeColons = num2cell(repmat(‘:’,dim-1,1));
afterColons = num2cell(repmat(‘:’,nDim-dim,1));
Srep.subs = {beforeColons{:} [g+1] afterColons{:}};
S.subs = {beforeColons{:} [1:g+1] afterColons{:}};
x = subsasgn(x,S,repmat(subsref(x,Srep),[ones(1,dim-1) g+1 ones(1,nDim-dim)])); % general case
[/matlab] The output of Srep is:

Srep =
type: ‘()’
subs: {‘:’ ‘:’ [2] ‘:’ }

thus subsref(x,Srep) outputs what x(:,:,2,:) would output. And then we need to repmat it, to fit the number of elements we replace by the winsorizing method.

This is put into subsasgn, where the S here is :

Srep =
type: ‘()’
subs: {‘:’ ‘:’ [1 2] ‘:’ }

Thus equivalent to x(:,:,[1 2],:).
The evaluated structure then is:
[matlab] x(:,:,[1:2]) = repmat(x[:,:,1],[1 1 2 1]) [/matlab]

The upper percentile is replaced analogous:
[matlab] % replace the right hand side
Srep.subs = {beforeColons{:} [n-g] afterColons{:}};
S.subs = {beforeColons{:} [n-g:size(x,dim)] afterColons{:}};

x = subsasgn(x,S,repmat(subsref(x,Srep),[ones(1,dim-1) g+1 ones(1,nDim-dim)])); % general case

[/matlab]

And in the end we can take the mean, var, nanmean or whatever we need:
[matlab] x = squeeze(nanmean(x,dim));
[/matlab]

That finishes the implementation.

Timing

But how about speed? I thus generated a random matrix of 200 x 10000 x 5 and measured the timing (n=100 runs) of the original limo implementation and mine:

algorithm timing (95% bootstraped CI of mean)
limo_winmean 185 – 188 ms
my_winmean 202 – 203ms
limo_winmean otherDimension than 3    218 – 228 ms

For the last comparison I permuted the array prior to calculating the winsorized mean, thus the overhead. In my experience, the overhead is greater the larger the arrays are (I’m talking about 5-10GB matrices here).

Conclusion

My generalization seems to work fine. As expected it is slower than the hardcoded version. But it is faster than permuting the whole array.

6 of 6
123456