Blog

How to use bimodal priors for bayesian data analysis in STAN

I tried adding a bi-modal prior in STAN for a homework exercise on Bayesian Data Analysis. At first, I thought this could work:
“`STAN
model{
mu ~ normal(-0.5,0.3) + normal(0.5,0.3);
}
“`
But it doesn’t. I had to dig deeper and I thought I could simply add multiple times to the log-posterior due to a sideremark of Bob Carpenter:

“`STAN
target += normal_lpdf(mu|.5,0.3);
target += normal_lpdf(mu|-.5,0.3);
“`
Which also does not work. Finally, the solution is akin to the mixture model in the STAN manual:

“`STAN
target += log_sum_exp(normal_lpdf(mu|.5,0.3),normal_lpdf(mu|-.5,0.3));
“`

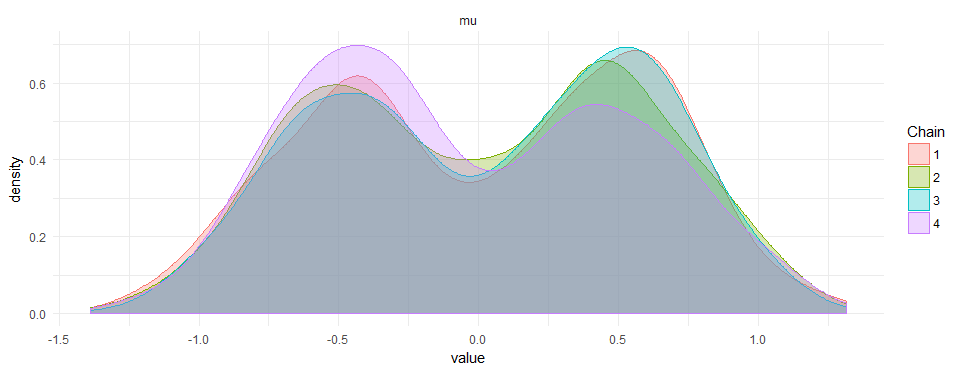
This results in beautiful bi-modal priors:

I did not find anything on google or the manual of how to do this. If there is a smarter way to do it, please leave a comment.

“`R

library(rstan)

model <- " data { } parameters { real mu; } transformed parameters { } model { //mu ~ normal(10,1); //mu ~ normal(-10,1); target += log_sum_exp(normal_lpdf(mu|-.5,.3),normal_lpdf(mu|.5,.3)); }" samples <- stan(model_code=model, iter=2000, chains=4, thin=1, # seed=123 # Setting seed; Default is random seed ) ggmcmc::ggs_density(ggmcmc::ggs(samples))+theme_minimal() ```

Scatterplots, regression lines and the first principal component

I made some graphs that show the relation between X1~X2 (X2 predicts X1), X2~X1 (X1 predicts X2) and the first principal component (direction with highest variance, also called total least squares).

The line you fit with a principal component is not the same line as in a regression (either predicting X2 by X1 [X2~X1] or X1 by X2 [X1~X2]. This is quite well known (see references below).

With regression one predicts X2 based on X1 (X2~X1 in R-Formula writing) or vice versa. With principal component (or total least squares) one tries to quantify the relation between the two. To completely understand the difference, image what quantity is reduced in the three cases.

In regression, we reduce the residuals in direction of the dependent variable. With principal components, we find the line, that has the smallest error orthogonal to the regression line. See the following image for a visual illustration.

For me it becomes interesting if you plot a scatter plot of two independent variables, i.e. you would usually report the correlation coefficient. The ‘correct’ line accompaniyng the correlation coefficient would be the principal component (‘correct’ as it is also agnostic to the order of the signals).

Further information:

How to draw the line, eLife 2013
Gelman, Hill – Data Analysis using Regression, p.58
Also check out the nice blogpost from Martin Johnsson doing practically the same thing but three years earlier 😉

Source

“`R
library(ggplot2)
library(magrittr)
library(plyr)

set.seed(2)
corrCoef = 0.5 # sample from a multivariate normal, 10 datapoints
dat = MASS::mvrnorm(10,c(0,0),Sigma = matrix(c(1,corrCoef,2,corrCoef),2,2))
dat[,1] = dat[,1] – mean(dat[,1]) # it makes life easier for the princomp
dat[,2] = dat[,2] – mean(dat[,2])

dat = data.frame(x1 = dat[,1],x2 = dat[,2])

# Calculate the first principle component
# see http://stats.stackexchange.com/questions/13152/how-to-perform-orthogonal-regression-total-least-squares-via-pca
v = dat%>%prcomp%$%rotation
x1x2cor = bCor = v[2,1]/v[1,1]

x1tox2 = coef(lm(x1~x2,dat))
x2tox1 = coef(lm(x2~x1,dat))
slopeData =data.frame(slope = c(x1x2cor,1/x1tox2[2],x2tox1[2]),type=c(‘Principal Component’,’X1~X2′,’X2~X1′))

# We want this to draw the neat orthogonal lines.
pointOnLine = function(inp){
# y = a*x + c (c=0)
# yOrth = -(1/a)*x + d
# yOrth = b*x + d
x0 = inp[1] y0 = inp[2] a = x1x2cor
b = -(1/a)
c = 0
d = y0 – b*x0
x = (d-c)/(a-b)
y = -(1/a)*x+d
return(c(x,y))
}
points = apply(dat,1,FUN=pointOnLine)

segmeData = rbind(data.frame(x=dat[,1],y=dat[,2],xend=points[1,],yend=points[2,],type = ‘Principal Component’),
data.frame(x=dat[,1],y=dat[,2],yend=dat[,1]*x2tox1[2],xend=dat[,1],type=’X2~X1′),
data.frame(x=dat[,1],y=dat[,2],yend=dat[,2],xend=dat[,2]*x1tox2[2],type=’X1~X2′))

ggplot(aes(x1,x2),data=dat)+geom_point()+
geom_abline( data=slopeData,aes(slope = slope,intercept=0,color=type))+
theme_minimal(20)+coord_equal()

ggplot(aes(x1,x2),data=dat)+geom_point()+
geom_abline( data=slopeData,aes(slope = slope,intercept=0,color=type))+
geom_segment(data=segmeData,aes(x=x,y=y,xend=xend,yend=yend,color=type))+facet_grid(.~type)+coord_equal()+theme_minimal(20)
“`

EEG: Contours in multiple topoplots

The problem

It is commonly accepted that axes of plots should align if data needs to be compared between subplots. But the default way on how multiple topoplots are plotted violates this principle. While usually the limits of the colormap are kept constant for all colormaps, the contours rarely are. This default plot looks similar to this one:

The solution

It is simple, keep the contours constant!

In eeglab this is done using the topoplot function with the argument 'numcontours', linspace(-scale,scale,n_contours) or similar. You can also use my new plotting script available here on github
So if we would keep the values constant at which contours are generated it looks like this:

More ideas

Each topoplot has its individual color-limits. While the local (in a single topoplot) extremata a clearly visible, not much to compare between topoplots

Individual contours improve the readability of each map, but they do not add anything that eases the comparison.

Forcing the same color-limits in the colormap allows for direct comparison between topoplots. But whether the white of the 9th’s or the 12th’s topoplot is bigger is hard to tell.

Going back to individual colormaps, but keeping the same contours: This helps already a lot, I seem to abstract the colormap away a bit and use the contours for comparison

The opposite way, same color-limits but individual contours. Again I seem to rely more on the contours, in this case this is more confusing than before.

In the final plot colormap and contour are aligned. This enhances comparison between topoplots.

One problem with the same color-limits or the same contour lines between topoplots is, that large deflections could hide small ones. As in many cases, it depends on what features of the data you want to highlight. I recommend the final plot where contour and colormap align as the default.

Conclusion

If you are plotting multiple topoplots, try to keep the color-limits of the colormap as well as the contour levels constant

Multitaper Time vs Frequency Resolution

Goal

Give a graphical representation of multitaper time frequency parameters.

Background

Frequency Resolution and sFFT

In M/EEG analysis we are often interested in oscillations. One tool to analyse oscillations is by using time-frequency methods. In principle they work by segmenting the signal of interest in small windows and calculating a spectrum for each window. A tutorial can be found on the fieldtrip page. There exists a time-frequency tradeof: $\delta f = \frac{1}{T}$ with T the timewindow (in s) and $\delta f$ the frequency resolution. The percentage-difference of two neighbouring frequency resolution gets smaller the higher the frequency goes, e.g. a $\delta f$ of 1 at 2Hz and 3Hz is 50%, but the same difference at 100Hz and 101Hz is only 1%. Thus usually we try to decrease the frequency resolution the higher we go. A popular examples are wavelets, they inherently do this. One problem with wavelets is, that the parameters are not perfectly intuitive (I find). I prefer to use short-time FFT, and a special flavour the Multitaper.

Multitaper

We can sacrifice time or frequency resolution for SNR. I.e. one can average estimates at neighbouring timewindows or estimates at neighbouring frequencies. A smart way to do this is to use multitapers, I will not go into details here. In the end, they allow us to average smartly over time or frequency.

Parameter one usually specifies

  • foi: The frequencies of interest. Note that you can use arbitrary high resolution but if you have $\delta foi < \delta f$ then information will be displayed redundantly (but it looks smoother).
  • tapsmofrq: How much frequency smoothing should happen at each foi.
  • t_ftimwin: The timewindow for each foi

Plotting the parameters

With the matlab-function attached to the end of the post one can see the effective frequency-resolution of the parameters in a single plot. For this example I use the frequency parameters by Hipp 2011. They logarithmically scale up the frequencybandwith. In order to do so for the low frequencies (1-16Hz) they change the size of the timewindow, for the higher frequencies they use multitaper with a constant window size of 250ms.

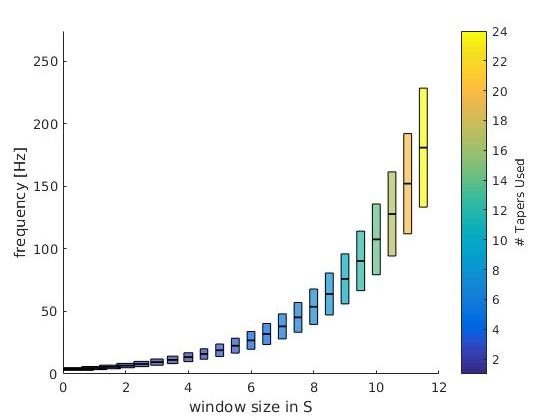
hipp_theoretical
This is the theoretical resolution (interactive graph), i.e. a plot of the parameters you put in. foi +- tapsmofrq scaled by each timewindow size. Note: The individual bar size depicts the window-size of the respective frequency-bin.

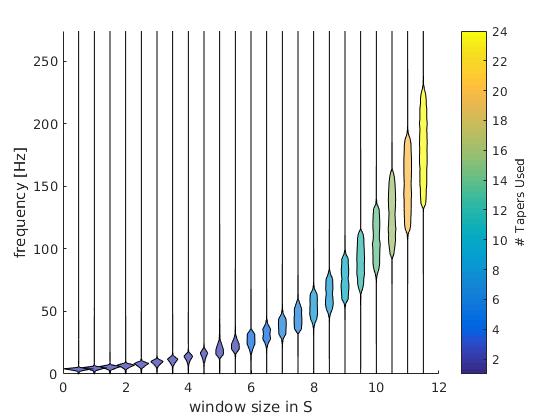
hipp_numeric
This is the numeric resolution (interactice graph). I used the frequency response of 100 repetitions of white noise (flat spectrum over repetitions) and calculated the frequency response of the multitaper filters. This is scaled in the x-axis by the time-window used.

Check out the interactive graphs to see how the time-windows change as intendet with lower frequencies.

The colorbar depict the number of tapers used. As intended, the number of tapers do not change from 1-16Hz.

Code

function [] = plot_taper(inpStruct,cfg)
%% plot_taper
% inpStruct: All fields need to have the same length
%   foi       : The frequencies of interest.    
%   tapsmofrq : How much frequency smoothing should happen at each foi (+-tapsmofrq)
%   t_ftimwin : The timewindow for each foi
% You can also directly input a fieldtrip time-freq object
%
% cfg:
%   logy      : plot the y-axis as log10
%   type      : "theoretical" : This plots the foi+-tapsmofrq
%               "numerical"   : Simulation of white noise to approx the
%               effective resolution

if nargin == 1
    cfg = struct();
end

if isfield(cfg,'logy')
    assert(ismember(cfg.type,[0,1]),'logy has to be 0 or 1')
    logy = cfg.logy;
else 
    logy = 0;
end
if isfield(cfg,'type')
    assert(ismember(cfg.type,{'numerical','theoretical'}),'type has to be ''numerical'' or ''theoretical''')
    type = cfg.type;

else
   type = 'numerical'; 
end
nRep = 100; % repetitions of the numeric condition
xscaling = 0.5;
if ~isempty(inpStruct) && isfield(inpStruct,'t_ftimwin')
    fprintf('cfg detected\n')
    cfg = inpStruct;
elseif ~isempty(inpStruct) && isfield(inpStruct,'cfg')
    fprintf('fieldtrip structure detected\n')
    cfg = inpStruct.cfg;
else
    fprintf('using parameters from Hipp 2010 Neuron \n')
    cfg =[];

    % we use logspaced frequencies from 4 to 181 Hz
    cfg.foi = logspace(log10(4),log10(181),23);

    % The windows should have 3/4 octave smoothing in frequency domain
    cfg.tapsmofrq = (cfg.foi*2^(3/4/2) - cfg.foi*2^(-3/4/2)) /2; % /2 because fieldtrip takes +- tapsmofrq

    % The timewindow should be so, that for freqs below 16, it results in n=1
    % Taper used, but for frequencies higher, it should be a constant 250ms.
    % To get the number of tapers we use:  round(cfg.tapsmofrq*2.*cfg.t_ftimwin-1)
    cfg.t_ftimwin = [2./(cfg.tapsmofrq(cfg.foi<16)*2),repmat(0.25,1,length(cfg.foi(cfg.foi>=16)))];
end

max_tapers = ceil(max(cfg.t_ftimwin.*cfg.tapsmofrq*2));
color_tapers = parula(max_tapers);
%%
figure
for fIdx = 1:length(cfg.t_ftimwin)
    timwin = cfg.t_ftimwin(fIdx);
    tapsmofrq = cfg.tapsmofrq(fIdx); % this is the fieldtrip standard, +- the taper frequency
    freqoi = cfg.foi(fIdx);
    switch type
        case 'theoretical'
            % This part simply plots the parameters as requested by the
            % user.
            y = ([freqoi-tapsmofrq freqoi+tapsmofrq freqoi+tapsmofrq freqoi-tapsmofrq]);

            ds = 0.3;
            ys = ([freqoi-ds freqoi+ds freqoi+ds freqoi-ds]);
            if logy
                y = log10(y);
                ys = log10(ys);
            end
            x = [-timwin/2 -timwin/2 +timwin/2 +timwin/2]+fIdx*xscaling;

            patch(x,y,color_tapers(round(2*timwin*tapsmofrq),:),'FaceAlpha',.7)
            patch(x,ys,[0.3 1 0.3],'FaceAlpha',.5)
        case 'numerical'
            fsample = 1000; % sample Fs 
            % This part is copied together from ft_specest_mtmconvol
            timwinsample = round(timwin .* fsample); % the number of samples in the timewin

            % get the tapers
            tap = dpss(timwinsample, timwinsample .* (tapsmofrq ./ fsample))';
            tap = tap(1:(end-1), :); % the kill the last one because 'it is weird'

            % don't fully understand, something about keeping the phase
            anglein  = (-(timwinsample-1)/2 : (timwinsample-1)/2)'   .*  ((2.*pi./fsample) .* freqoi);

            % The general idea (I think) is that instead of windowing the
            % time-signal and shifting the wavelet per timestep, we can multiply the frequency representation of
            % wavelet and the frequency representation of the data. this
            % masks all non-interesting frequencies and we can go back to
            % timespace and select the portions of interest. In formula:
            % ifft(fft(signal).*fft(wavelet))
            %
            % here we generate the wavelets by windowing sin/cos with the
            % tapers. We then calculate the spectrum
            wltspctrm = [];
            for itap = 1:size(tap,1)
                coswav  = tap(itap,:) .* cos(anglein)';
                sinwav  = tap(itap,:) .* sin(anglein)';
                wavelet = complex(coswav, sinwav);
                % store the fft of the complex wavelet
                wltspctrm(itap,:) = fft(wavelet,[],2);
            end


%           % We do this nRep times because a single random vector does not
%           have a flat spectrum.
            datAll = nan(nRep,timwinsample);
            for rep = 1:nRep
                sig = randi([0 1],timwinsample,1)*2-1; %http://dsp.stackexchange.com/questions/13194/matlab-white-noise-with-flat-constant-power-spectrum
                spec = bsxfun(@times,fft(sig),wltspctrm'); % multiply the spectra 
                datAll(rep,:) = sum(abs(spec),2); %save only the power
            end
            dat = mean(datAll); %average over reps


            % normalize the power
            dat = dat- min(dat);
            dat = dat./max(dat);

            t0 = 0 + fIdx*xscaling;
            t = t0 + dat*timwin/2;
            tNeg = t0 - dat*timwin/2;

            f = linspace(0,fsample-1/timwin,timwinsample);%0:1/timwin:fsample-1;
            if logy
                f = log10(f);
            end
            % this is a bit hacky violin plot, but looks good.
            patch([t tNeg(end:-1:1)],[f f(end:-1:1)],color_tapers(2*round(timwin*tapsmofrq),:),'FaceAlpha',.7)
    end


end
c= colorbar;colormap('parula')
c.Label.String = '# Tapers Used';
caxis([1 size(color_tapers,1)])

set(gca,'XTicks',[0,1])
xlabel('width of plot depicts window size in [s]')
if logy
    set(gca,'ylim',[0 log(max(1.2*(cfg.foi+cfg.tapsmofrq)))]);
    ylabel('frequency [log(Hz)]')
else
    set(gca,'ylim',[0 max(1.2*(cfg.foi+cfg.tapsmofrq))]);
    ylabel('frequency [Hz]')
end
end

Latency Measurements in a Vision Lab

We recently moved to a new building and the labs moved with us. We did not only use this opportunity to get rid of old computers and monitors, but also to thoroughly check that our timing is correct.

This work was mostly done by Ule Diallo, an intern from Marburg University. We were very lucky to have him!

TLDR;

We searched for fixed and jittered delays in our setup. We measured many monitors with two luminance sensors. We also checked our parallel-ports trigger-timing. We did not find jittered delays, the fixed delays are, as expected, only by the monitors.

Why is timing important?

For EEG, but also Eye-Tracking or Reaction Time measurements, effects can be quite small (for some paradigms \<10ms effects can be important. Measurement noise can be an issue (even though I recently read a paper that jitters of 10-15ms do not matter because subject variance is so high, but I can’t find it right now). For computer mice you can see an example of high jitter here and mice are supposed to be faster/less variable than keyboards!

In EEG, a P100 component is maybe 30ms broad. You don’t necessarily want to jitter it even further.

For most purposes, a fixed delay does not matter, you could simply recalculate your EEG or your reaction times. But a jitter is really the bad thing, very difficult to compensate for!

Where does jitter come from?

  1. Presentation programs
  2. Synchronization delays between computers/systems/amplifiers/eyetrackers/parallelports
  3. Lag of LCD/CRT Monitors
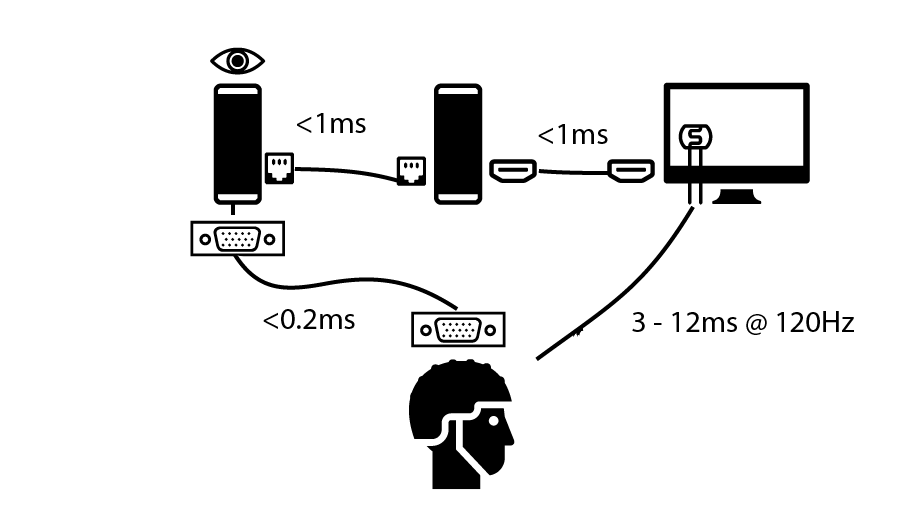
    monitor_delays
    Left PC is the eyetracking computer (eyelink/SR-Research). Middle computer is the stimulus computer, right is the monitor with a custom made luminance sensor and bottom the EEG amplifier. As you can see from the graph, the monitor (measured by a photosensor) is really the biggest source of delay (if not strictly controlled).

Parallel Port Timing

Our stimulus host PC communicates with the EEG using parallel port electrical triggers. We first of all confirmed that we can trigger with submillisecond speed (see table here). Also sometimes we use an eye-tracker (ET) in the loop. What we do is send over LAN a command to set the parallel port of the ET host which goes to the EEG. By that we have all three machines synchronized by the event. Again we find only some glitches in less than 0.0002% of cases (all glory details here).

Monitor timing

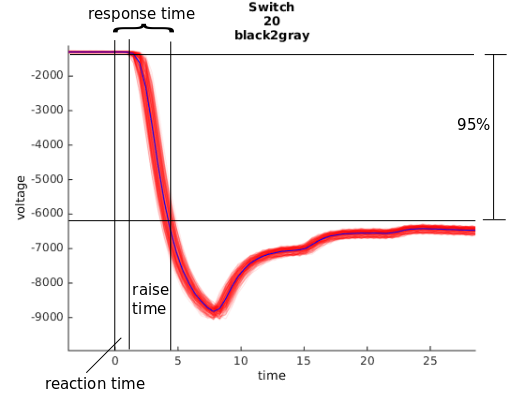
We mostly use LCD monitors in our lab, and I have the feeling that many labs move towards those monitors (away from CRT technology) anyway. We measured the input lag (the time needed to detect the first luminance-change) and the raise-time (the time needed until the actual color/luminance we wanted was reached). The sum of the two are called responsetime
timings explained

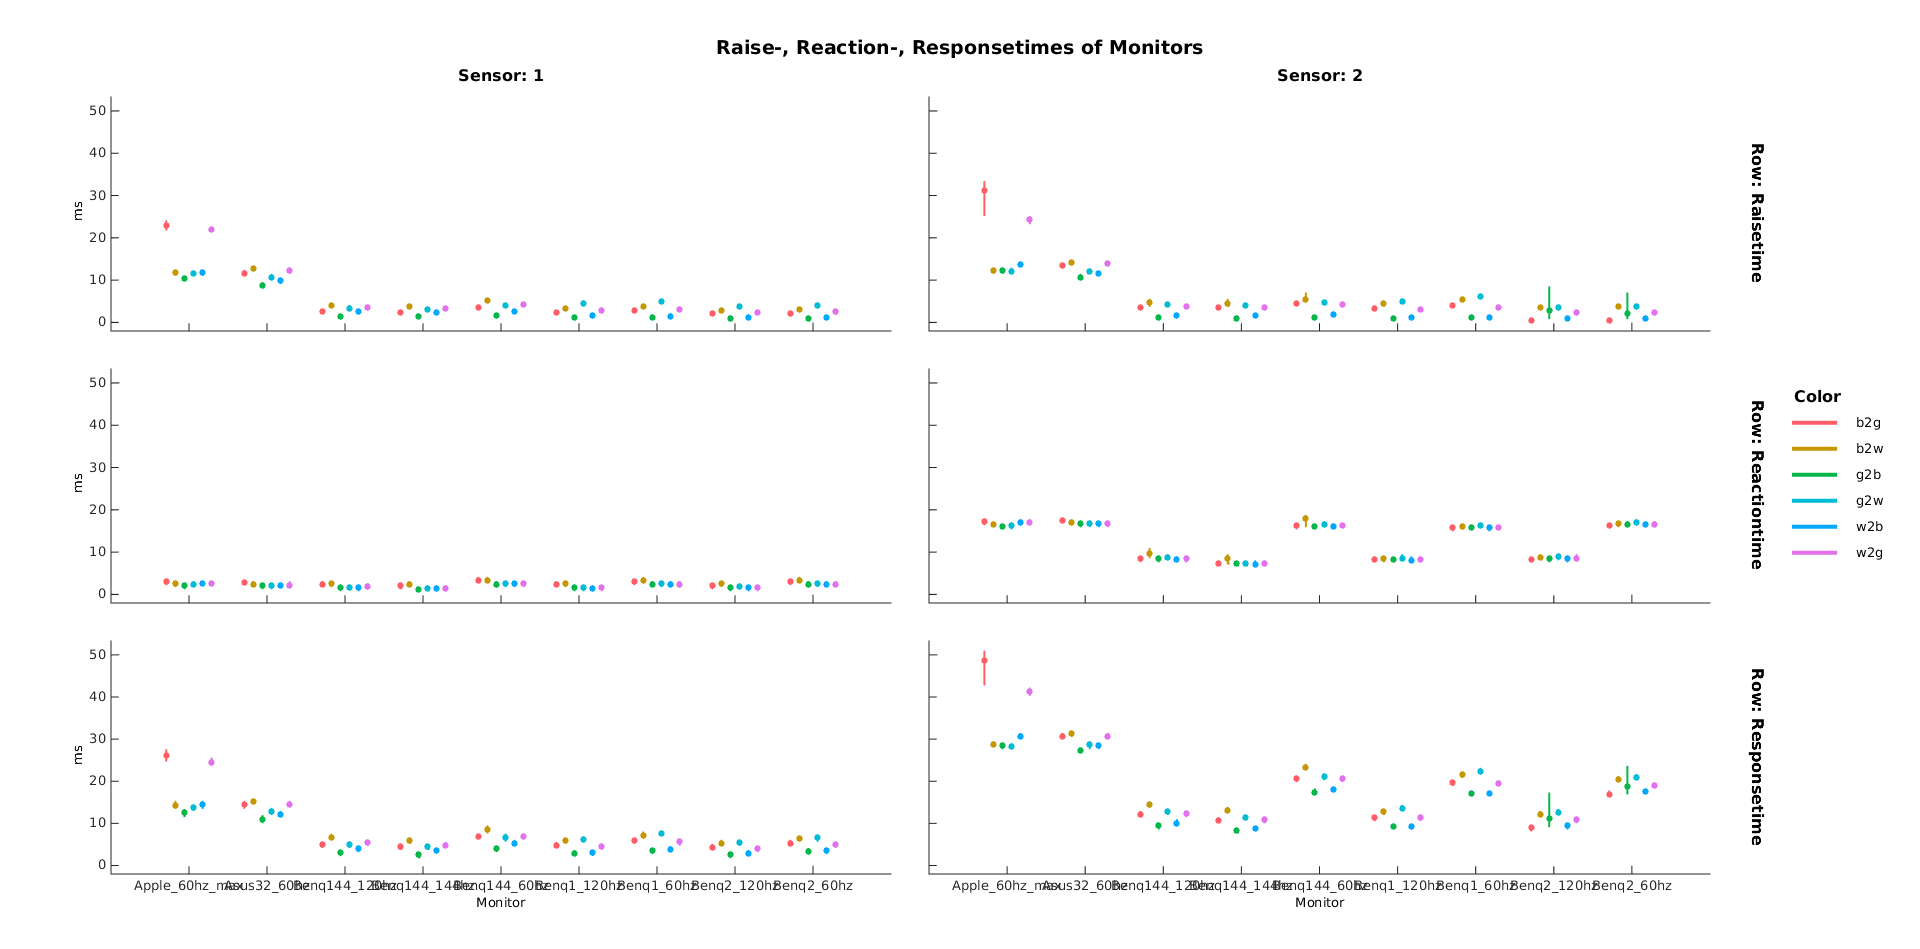
We displayed the stimuli using psychtoolbox-3, we waited after each stimulus draw for the vertical-refresh (in addition to V-Sync). Ule wrote some scripts to automatically extract the relevant numbers. The summary plot can be seen here:
summary plot lcd timing
X-Axes are different monitors, Y-Axes are the measured delays, lower is better. Top-Row is the raisetime, middle row the input lag and last row is the summed responsetime. Colors depict different changes i.e. from white to black, white to gray etc. Columns depict two different sensors, sensor one on the top, sensor two at the bottom of the screen. The monitors seem to respond with a low variance (errorbars are SD). Good news for us!

We see that gray to white and black to white are several milliseconds slower than switches from black to gray or gray to black.

We see that our old Apple Cinema 30″ monitor has some trouble (and also in generally is slow). Likely cause: old IPS Panel and PMD (see below) for backlight.
Luckily we recently replaced it with an Asus 32″ inch, the second in line. Our BenQ Monitors (2 identical ones and one 144Hz) seem to run just fine, with a minimal total input lag of ~8ms to 14ms (the right panel shows the luminance in the lower right corner, thus a delay of one refresh is expected, with 144Hz that’s 7ms).

Lessons Learned

  • Pulse-Width-Modulation ruins your day
    Some monitors change the brightness by turning on and off the backlight with a given frequency. This is called PWM. The frequency can be as low as 200Hz. You clearly don’t want to have additional strong modulation in your monitor. Either check that your monitor does not do PWM or turn the brightness completely up

  • The bottom of the monitor is one refreshtime slower than the top.
    The refresh of a LCD monitor starts on the top and ends at the bottom, thus with 120Hz you have a 8ms time delay between top and bottom. With 60Hz a 16ms delay. This is also true for CRTs. I like this video

Bonus: G-Sync/FreeSync vs. V-Sync

Disclaimer: We don’t own a FreeSync/G-Sync system, but this is what I understood while reading a lot about monitors. check out this longer guide

A screen is refreshed every 8.33ms (@120Hz). It sometimes happen, that your frame has been calculated faster than the 8ms. In principle the graphicscard can force the monitor to restart its updating from the top with the new frame. This results in ugly “tearing” of the monitor. To get rid of it, V-Sync forces the graphicscard to wait until the refresh of the monitor is finished.

FreeSync/GSync is a different thing: Usually the monitor starts a new refresh immediately after it finished the old one. If no new frame arrived it will update the old one. With G-Sync it simply waits until a new frame has been produced and thus possible is faster, without any tearing.

Thus for only reducing input-lag, i.e. for gaze-dependent display, g-sync does not really help – if your calculations are all well below ~8ms (which they usually are for our experiments)

Conclusions

All in all I’m very happy with our setup. We don’t have mayor lags or jitters somewhere, we now know exactly how much to correct and we have a nice infrastructure to remeasure the monitors for each experiment. I also learned quite a bit about monitors and latency measurements.

Thanks

Many thanks to Ule Diallo for doing most of the work. Also thanks to Silja Timm and Anna Gert

Graphics/Icons:

The icons were taken from the awesome Noun Projekt
by Edward Boatman,by Iconic,by Ji Sub Jeong, by Hans, by Vaibhav Radhakrishnan, by ProSymbols

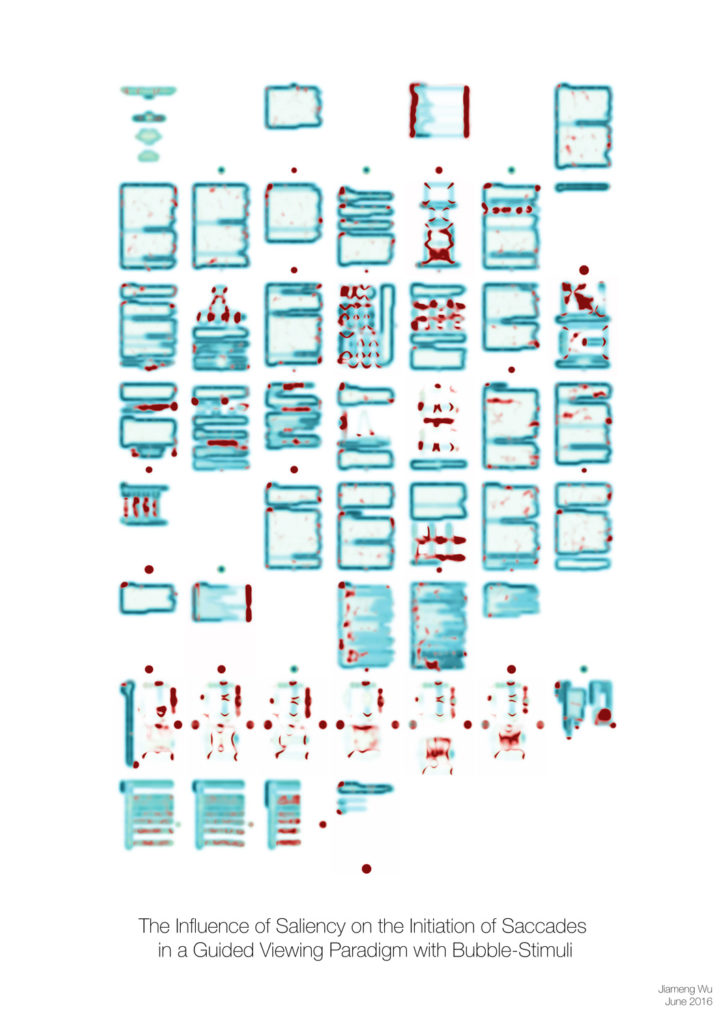
Jiameng Wu: The influence of Saliency on the Initation of Saccades in a Guided Viewing Paradigm with Bubble-Stimuli

One of my bachelor’s students (Jiameng Wu) finished her thesis on parts of this project. I again tried to make art out of science.

jwu_bachelorthesis_saliency

In this piece I used three of her features on different scales and calculated them for each page of her thesis. I then recombined and arranged them. In eye-tracking these image features are commonly used to analyse where people look (high contrast regions and the like). In this case we find surpringly emerging global structures (I mean the guy with a tophat in row 2 or the cat in row 3) .

The idea is to inspire discussion with persons who do not have an academic background or work in a different field. The thesis is hidden in the drawer, but the poster is out there at the wall for everyone to see.
Find two other pieces here and here

ICA weights and invweights

Update 01.08.2016

after further discussion we discovered that the correlation matrix was a bit off. This is because I plotted the correlation of the weights without the sphering (=whitening) step. Sphering removes the correlation between the components. I added a plot with the correlation after sphering and updated the topographies.

Goal

In EEG blind source separation using ICA, understand the difference between the mixing matrix and the unmixing matrix.

brief introduction

The blind source separation problem in the context of EEG can be understood as follows:
$$ mixing * sourceactivity = EEGdata $$
In words: We have some sources active and we know their projections on each electrode: We take the dot product (we multiply each source with its projection and add them all up).
More formally:

$$
\begin{align}
A &: mixing\\
s &: sourceactivity\\
x &: EEGdata \\
A * s &= x\\
\end{align}
$$
Because every neuronal source projects to most (or even all) sensors/electrodes, the original brain-source activation can only be recored in a mixed way.
Thus in order to unmix we can use blind source separation (ICA details can be found here)
$$
\begin{align}
W &: unmixing \\
unmixing * EEG.data &= sourceactivity \\
W * x &= s \\
\end{align}
$$
The relation between mixing and unmixing matrix in ICA (and other BSS methods) is:

$$
\begin{align}
A * s & = x\\
A^{-1} * A * s & = A^{-1} * x\\
s & = A^{-1} * x\\
A^{-1}& = W\\
\end{align}
$$
This is only true if $A$ is invertible and square (if non-square you have to use a pseudoinverse, see the Haufe 2014 paper for more information)

The matrix $W$ is also known as the extraction filter

The matrix $A$ is also know as the activity pattern

EEG ICAs

In eeglab the default infomax-ICA algorithm uses a sphering (whitening) step before calculating the weights. Thus the following relation is true:

[code lang=text] EEG.icawinv = pinv( EEG.icaweights * EEG.icasphere) % the mixing matrix, channels x sources
EEG.icaact = EEG.icaweights*EEG.icasphere)*EEG.data % the activation, sources x time
[/code]

This is how ICA components look, on the left the weights after sphering-preprocessing, middle the unmixing matrix and on the right the mixing matrix. Usually we should look at the mixing matrix ($A = W^{-1}$).
blog_topoplots
The weights after decorrelation (=sphering) seem to be quite similar, but the unmixing ($W$) looks very different and is actually very hard to interprete!
One interesting thing to look at is the correlation between the component-vectors (in this case 32 components). As we can see here:
blog_correlationmatrix
Note that the correlation of the EEG.icaweight matrix is 0 because it is a pure rotation matrix (which is orthognal, thus correlations of 0). As explained here the whitening step estimates the stretching and thus only a rotation remains for the EEG.icaweight matrix.

More information

Haufe et. al. 2014(pdf-openaccess-link) have a very nice paper around this issue.

TLDR; Don’t look at your filter/unmixing matrix.

Thanks to

Holger Finger, Anna Lisa Gert, Tim Kietzmann,Peter König, Andrew Melnik ( in alphabetical order) for discussions.

01-2023: Thanks to Fabiano Baroni for noticing I had $$W$$ & $$A$$ switched up throughout the blog post!!

Permutation Test for matlab

This is taken and copied from github/behinger/permtest:
I couldn’t find a simple permutation test for matlab, thus I decided to implement it on my own. I got inspired by the “statmod”-R package and followed Phipson & Smyth 2010’s recommendations.

How to Use:

[code lang=matlab] permtest(randi([1,5],100),randi([3,8],100))
permtest(randi([1,5],100),randi([3,8],100),10000)
permtest(randi([1,5],100),randi([3,8],100),[],\"conservative\") % usually the fastest implementation
[/code]

Permutations / Randomization

I chose to do permutations with repeats. This complicates p-values, but in the end I found it to be faster (and scales better).

P-Values

There are three methods implemented to get the p-value:

b = permutations with greater value than test-statistic

m_t = number of possible permutations

P-values of complete permutations cannot be exactly 0, because the original permutation is included in the set of permutations, thus the minimal p-value has to be 1/nPerm. This first formula makes sure of that and is most commonly used. If you use an implementation that does not allow for repeated permutations, you can stick with this one (but thats not my implementation ;)).

method = ‘conservative’
$$p_u = p_t =\frac{ b+1}{nPerm+1}$$

method = ‘exact’
$$p_e = 1/(m+1) + \sum_{p=1/m_t}^{1}(binocdf(b,nperm,p))$$

method = ‘approximate’
$$p_e \approx p_a = p_u – \int_{p=0}^{0.5/(m_t+1)}(binocdf(b,nperm,p))$$

It is true that $p_u >p_e$ (see Phipson & Smyth 2010).

Checks

  • I can repeat Figure 1 from Phipson & Smyth 2010
  • I get a flat histogram for two null effects
  • I get 5% false positives at alpha=0.05

Future Implementation

  • Add custom – function ability to select your own test-statistic (now its simply mean between groups). e.g. t-stat
  • Add non-repeated permutations
  • Parallelize calculations similar to the statmod-R implementation. This allows for many tests to be calculated at the same time. I recommend to use the “GaussQuad.m” function from matlab to do it (have a look at the perm function from statmod).

Dummy coding and Effects coding

A small fact got me into trouble (spoiler: the intercept in effects coding represents the mean of conditions, not the data-mean).

Update 2016-08-11

I found a nice paper that remedies the last point: weighted effects coding

Update 2018-11-30

If you enjoyed reading this post, check out my sucessor post on Effect/Sum Coding

Update 2019-07-22

I highly recommend this recent paper: How to capitalize on a priori contrasts in linear (mixed) models: A tutorial (2019) which will explain all things of this blogpost in more space, more examples, more code and with better words!

The goal

We try to model two factors with two levels using a linear model. We therefore need a schema to model categorical variables as if they were continuous variables.

2×2 “ANOVA”

To start, we have take a typical 2×2 ANOVA design. It is balanced (each ‘cell’ has equal number of data points) and homoskedastic (equal variance in each cell).
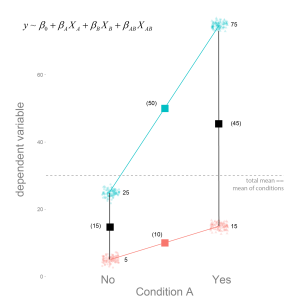
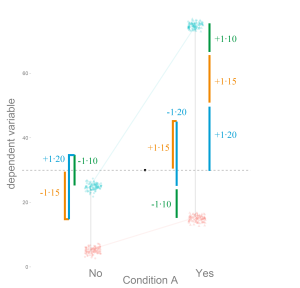
dummy_effects_coding-07

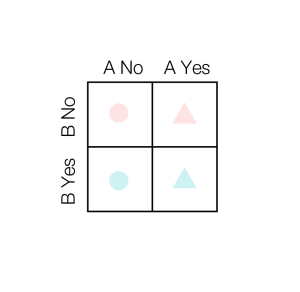
As you see here, there are two Factors, A and B, with two levels each. For example A could be “Drives a Car”, and B could be “Owns a Suit”. The dependent variable, which we try to explain, could be “Total Money”. Alternatively in Cognitive-Neuroscience, A could be “Drank coffee before experiment” and B could be “Slept before experiment”, the dependent variable in that case could be “Alpha-Band-EEG-Amplitude”

The data are split up by A, and color coded by B. A in addition is shape-coded. If A is “no” as well as B, we get the smallest dependent variable, if both are “yes” we get the largest one.
dummy_effects_coding-01
I already put the linear regression model we are going to use in the image. As well as the respective means.

Main Effects

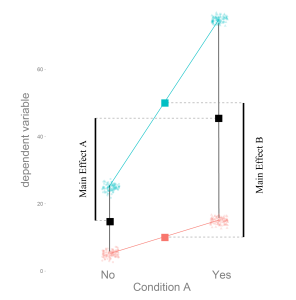
We are usually interested in the “main-effects”, which are depicted in the next picture.
dummy_effects_coding-06
How much does the dependent variable change, if we move from A “no” to A “yes”. In this case the main effect of A is 30, and of B is 40.

This categorical main effects can be estimated by linear regression. Because naively linear regression only works for continuous variables, we need a way to describe the categorical variables as continuos variables. In principle we want to fit the red and cyan line depicted in the plots. There are two often used methods to solve this with linear model coding. Dummy Coding and Effects Coding.

Dummy Coding

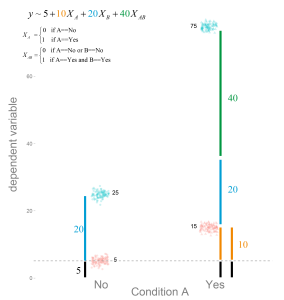
Let’s start with Dummy Coding. We simply set the first level (‘no’) to 0, and the (‘yes’) to 1. That is, we think of it as a continuous variable which has data only at two distinct values and code it as $X_A$.
Thus for each factor we get one slope which we call $\beta_A$ and $\beta_B$ but in addition we could have an interaction, thus we code this as well. The interaction is simply the multiplication of the two main Factors, thus it is coded with 1, only if A and B are both 1 as well ($\beta_{AB}$).
We estimated the betas (see following image).

How do we interprete the coefficients?
dummy_effects_coding-02
From the image it should become clear, that with dummy coding we are estimating the location of the cell-means. In order to calculate the main effects we would need some additional calculations.

Effects Coding

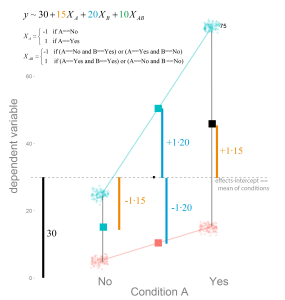
For effects coding we set the ‘no’ to -1 (or -0.5 if you prefer) and the ‘yes’ to +1 (or +0.5).
dummy_effects_coding-03
You can clearly see, that the parameter estimates are the main-effects, not the cell-means anymore. $2\cdot\beta_A $ is the main effect of A. Why $\cdot 2$? Because we coded with -1 / +1 (thus the difference e.g. the jump from -1 to 1 is 2), if we would use -0.5 / 0.5 (thus the difference is 1 as in the dummy coding above) the parameter estimate directly represents the main effects.

How do we get the cell-means from effects coding?
dummy_effects_coding-05
An example might be appropriate to better see what it means:
$$\hat{y} = \beta_0 + \beta_A X_A + \beta_B X_B + \beta_{AB} X_{AB}$$

We want to know the cell mean of B ‘yes’ if A is ‘no’. Thus $X_B = +1$ and $X_A = -1$. As written before $X_{AB}$ is the multiplication, thus $X_{AB} = X_B \cdot X_A = -1 \cdot +1 = -1$.

$${\hat{y}} = \beta_0 + \beta_A \cdot -1+ \beta_B \cdot +1 + \beta_{AB} \cdot -1$$

Intercepts

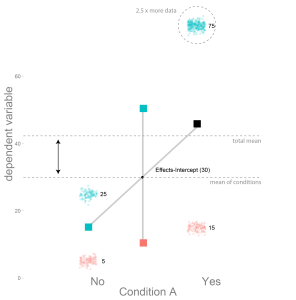
As visible in the graphs the intercepts of dummy coding represents the reference category, here the value of A=’no’ and B=’no’. The intercept of effects coding represents the mean of the conditions. This can be very different from the the total mean of the data, if you have unbalanced data:
dummy_effects_coding-04
Here the A=’yes’ and B=’yes’ condition has 2.5 times more data-points, thus it moves the total-mean upwards. But the effects did not change, thus the condition means and the mean of the condition means did not change.
It is actually qiute useful, that the effects coding intercept does not represent the total mean, but the mean of condition means.

And that’s it. When should you use which? I don’t think there is a clearcut case for one or the other. It boils down to interpretation and personal preference, but some cases it is more useful to have the one and in other the other. See for example here under “why use effects coding”.

Further reading

Effect coding versus dummy coding in analysis of data from factorial experiments
A list of different coding schemes

Lilli Kaufhold: The influence of Fixation Durations on the Initiation of Saccades

One of my Master students (Lilli Kaufhold) finished her thesis on parts of this study (manuscript forthcoming). I took the opportunity to form her work into a pice of art.

It is a meta-study of an eye-tracking study. I recorded my eye-movements while reading her thesis about eye movements(using these cool 3D-printable open source eye trackers!) . Every red dot is a fixation (a moment where the eye stayed still) and every line connects two fixations with an eye movement. It is clear that I focused on the words, but some figures elicit specific eye tracking behaviour. Of course it is up to the viewer to figure out, which page contains what content.

Lilli Kaufhold Master Thesis

The idea is to inspire discussion with persons who do not have an academic background or work in a different field. The thesis is hidden in the drawer, but the poster is out there at the wall for everyone to see.
This is the second piece, for the first one see here.

5 of 6
123456