Dummy coding and Effects coding
A small fact got me into trouble (spoiler: the intercept in effects coding represents the mean of conditions, not the data-mean).
Update 2016-08-11
I found a nice paper that remedies the last point: weighted effects coding
Update 2018-11-30
If you enjoyed reading this post, check out my sucessor post on Effect/Sum Coding
Update 2019-07-22
I highly recommend this recent paper: How to capitalize on a priori contrasts in linear (mixed) models: A tutorial (2019) which will explain all things of this blogpost in more space, more examples, more code and with better words!
The goal
We try to model two factors with two levels using a linear model. We therefore need a schema to model categorical variables as if they were continuous variables.
2×2 “ANOVA”
To start, we have take a typical 2×2 ANOVA design. It is balanced (each ‘cell’ has equal number of data points) and homoskedastic (equal variance in each cell).

As you see here, there are two Factors, A and B, with two levels each. For example A could be “Drives a Car”, and B could be “Owns a Suit”. The dependent variable, which we try to explain, could be “Total Money”. Alternatively in Cognitive-Neuroscience, A could be “Drank coffee before experiment” and B could be “Slept before experiment”, the dependent variable in that case could be “Alpha-Band-EEG-Amplitude”
The data are split up by A, and color coded by B. A in addition is shape-coded. If A is “no” as well as B, we get the smallest dependent variable, if both are “yes” we get the largest one.

I already put the linear regression model we are going to use in the image. As well as the respective means.
Main Effects
We are usually interested in the “main-effects”, which are depicted in the next picture.
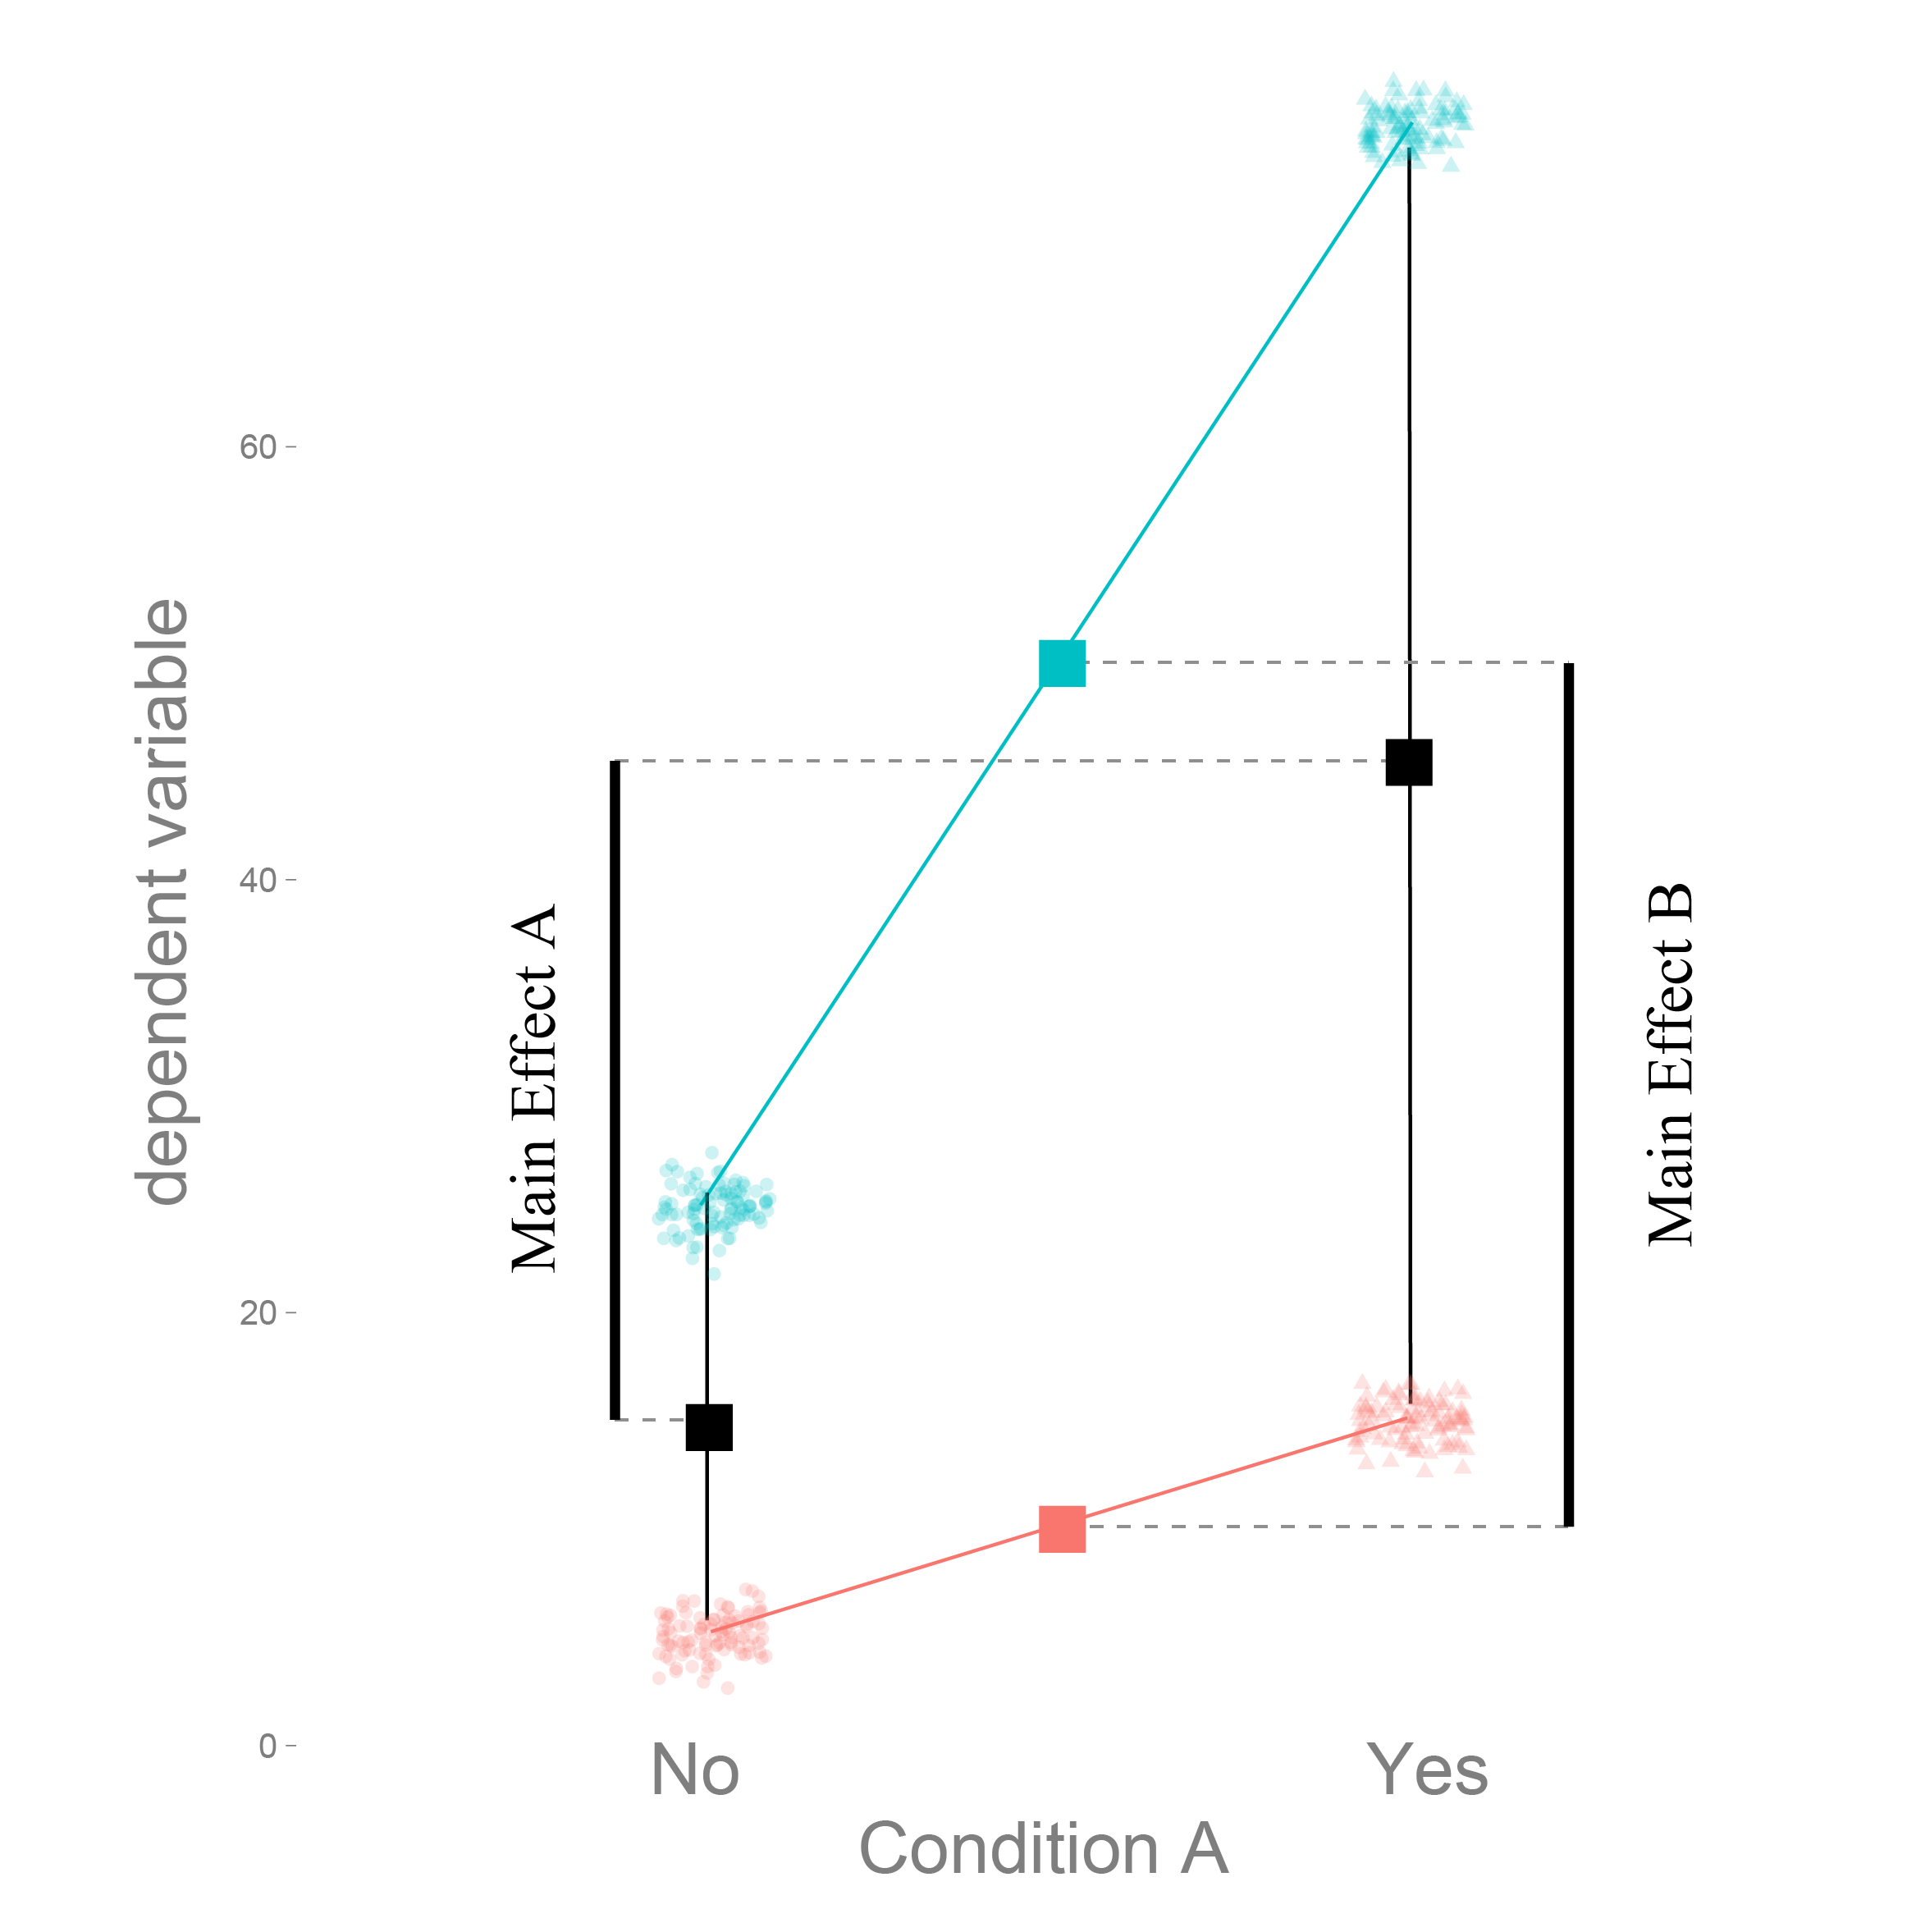
How much does the dependent variable change, if we move from A “no” to A “yes”. In this case the main effect of A is 30, and of B is 40.
This categorical main effects can be estimated by linear regression. Because naively linear regression only works for continuous variables, we need a way to describe the categorical variables as continuos variables. In principle we want to fit the red and cyan line depicted in the plots. There are two often used methods to solve this with linear model coding. Dummy Coding and Effects Coding.
Dummy Coding
Let’s start with Dummy Coding. We simply set the first level (‘no’) to 0, and the (‘yes’) to 1. That is, we think of it as a continuous variable which has data only at two distinct values and code it as $X_A$.
Thus for each factor we get one slope which we call $\beta_A$ and $\beta_B$ but in addition we could have an interaction, thus we code this as well. The interaction is simply the multiplication of the two main Factors, thus it is coded with 1, only if A and B are both 1 as well ($\beta_{AB}$).
We estimated the betas (see following image).
How do we interprete the coefficients?
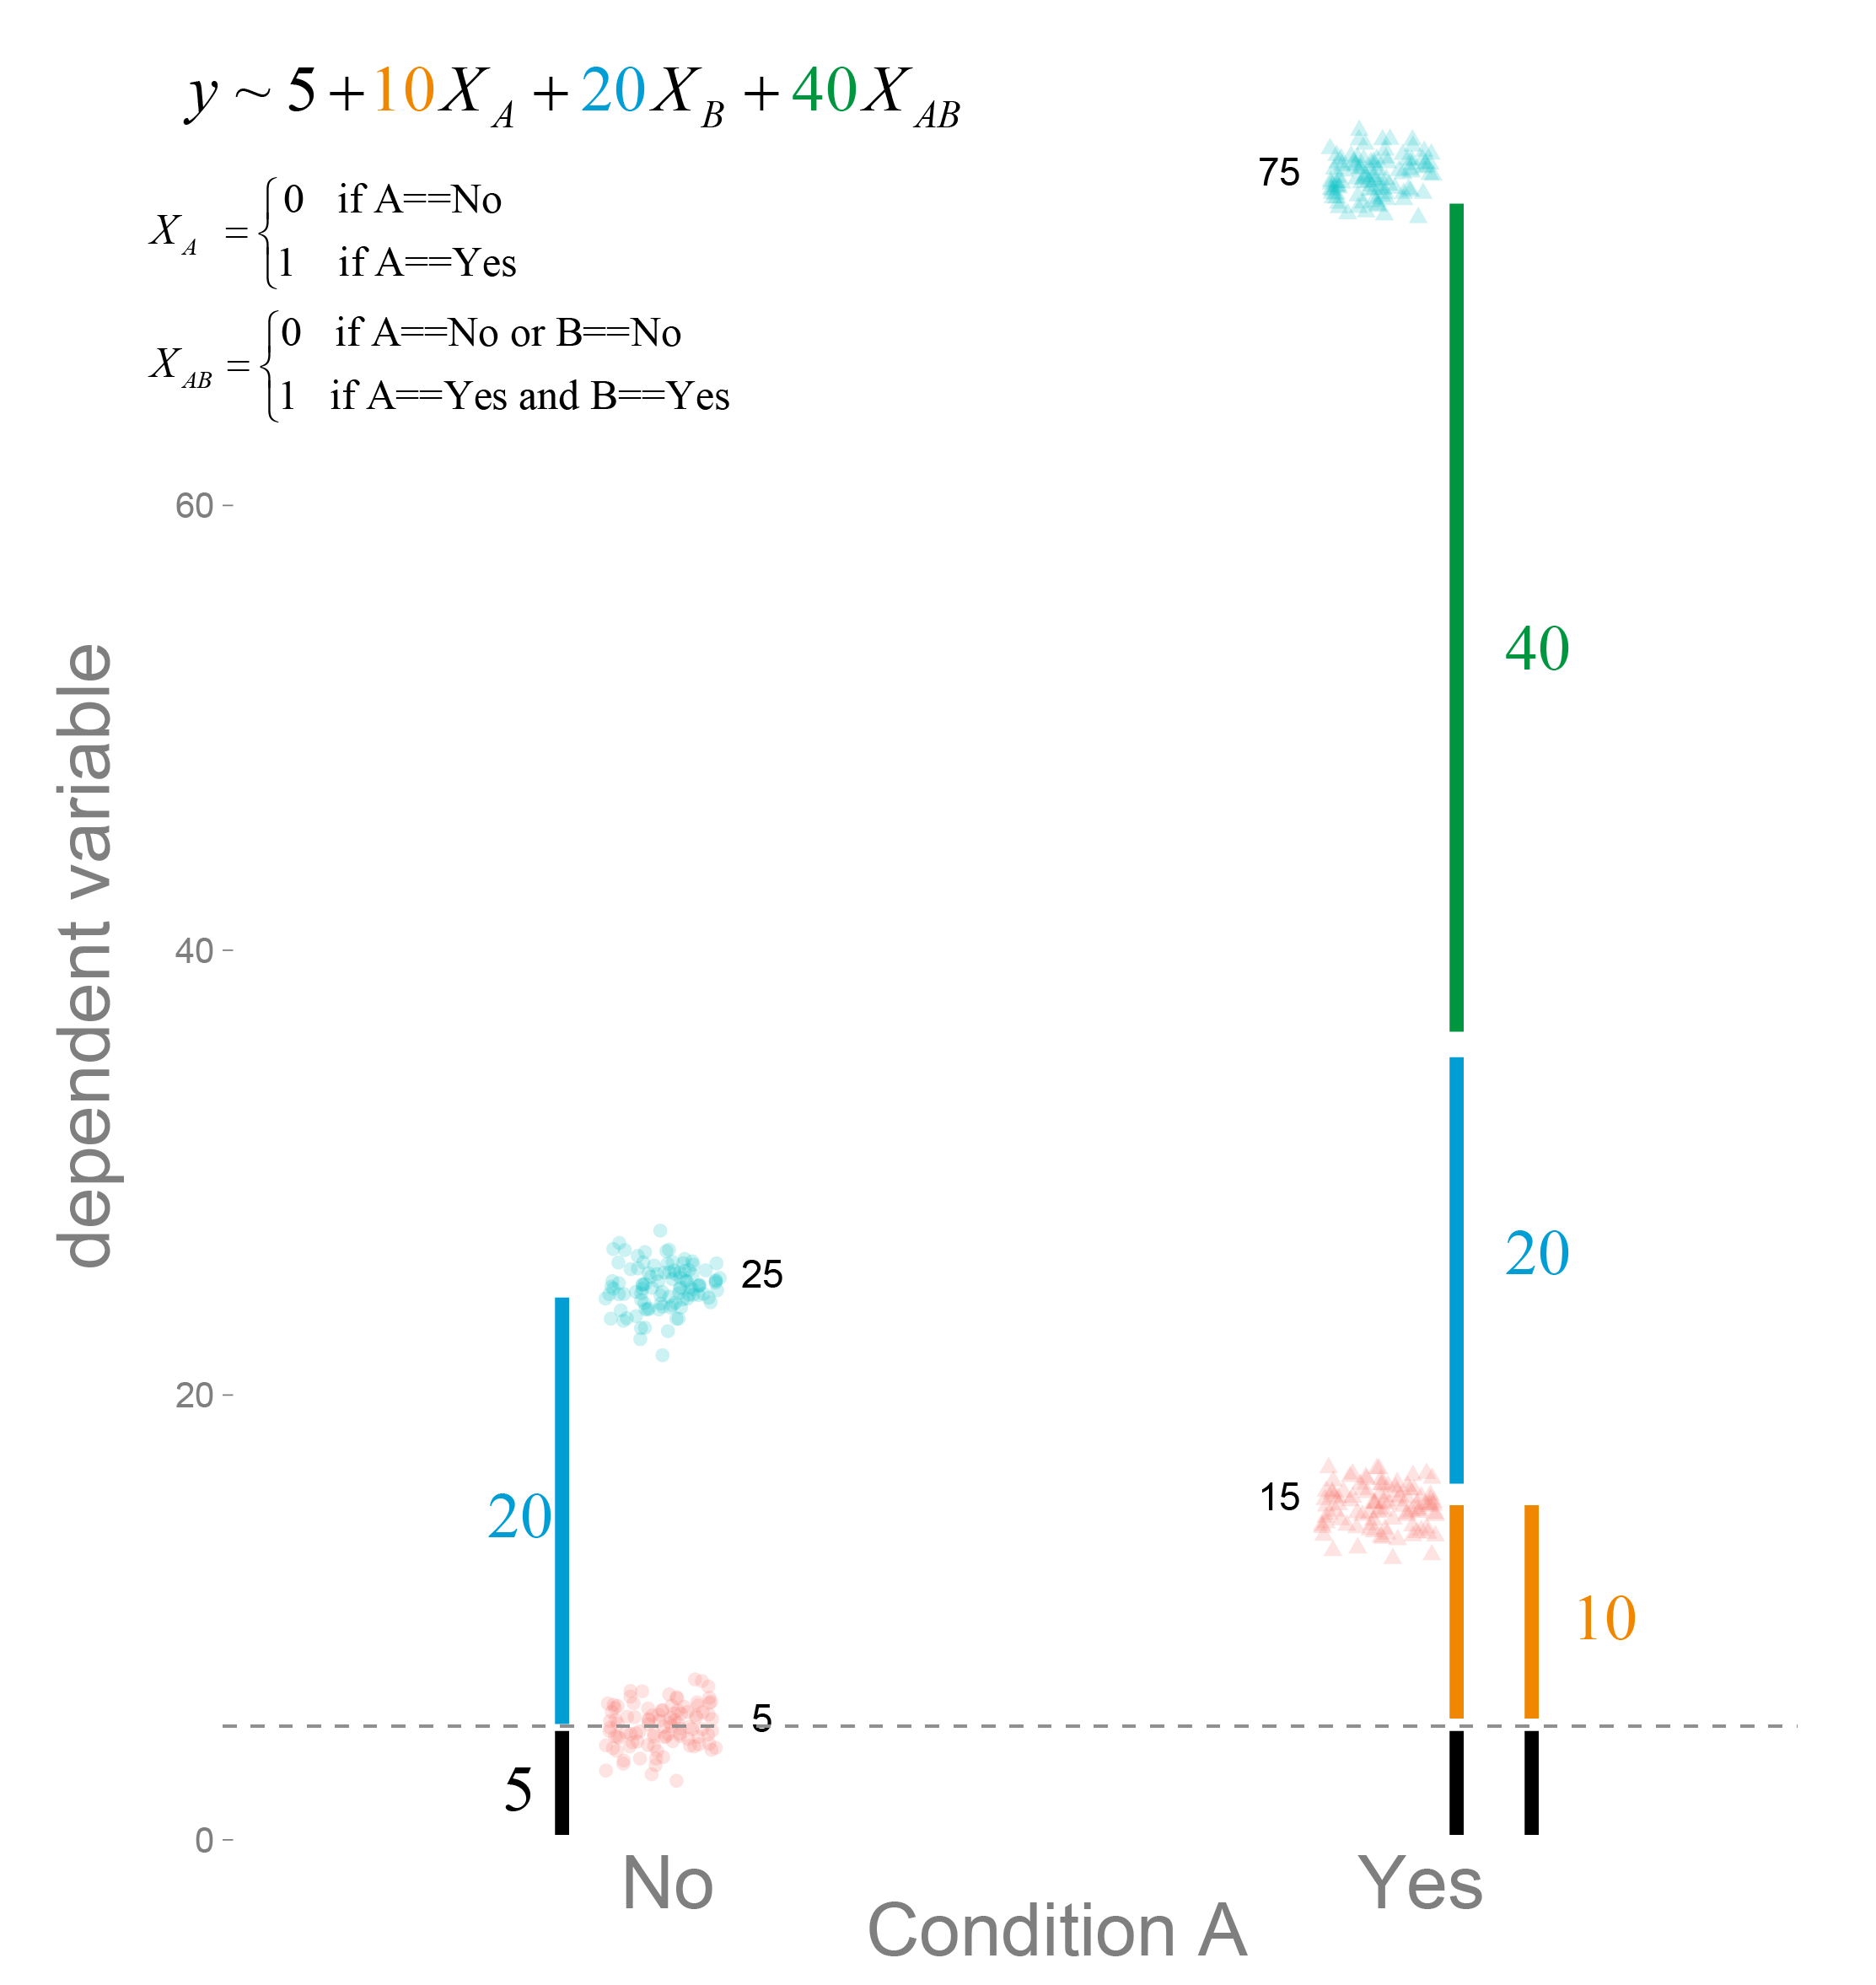
From the image it should become clear, that with dummy coding we are estimating the location of the cell-means. In order to calculate the main effects we would need some additional calculations.
Effects Coding
For effects coding we set the ‘no’ to -1 (or -0.5 if you prefer) and the ‘yes’ to +1 (or +0.5).
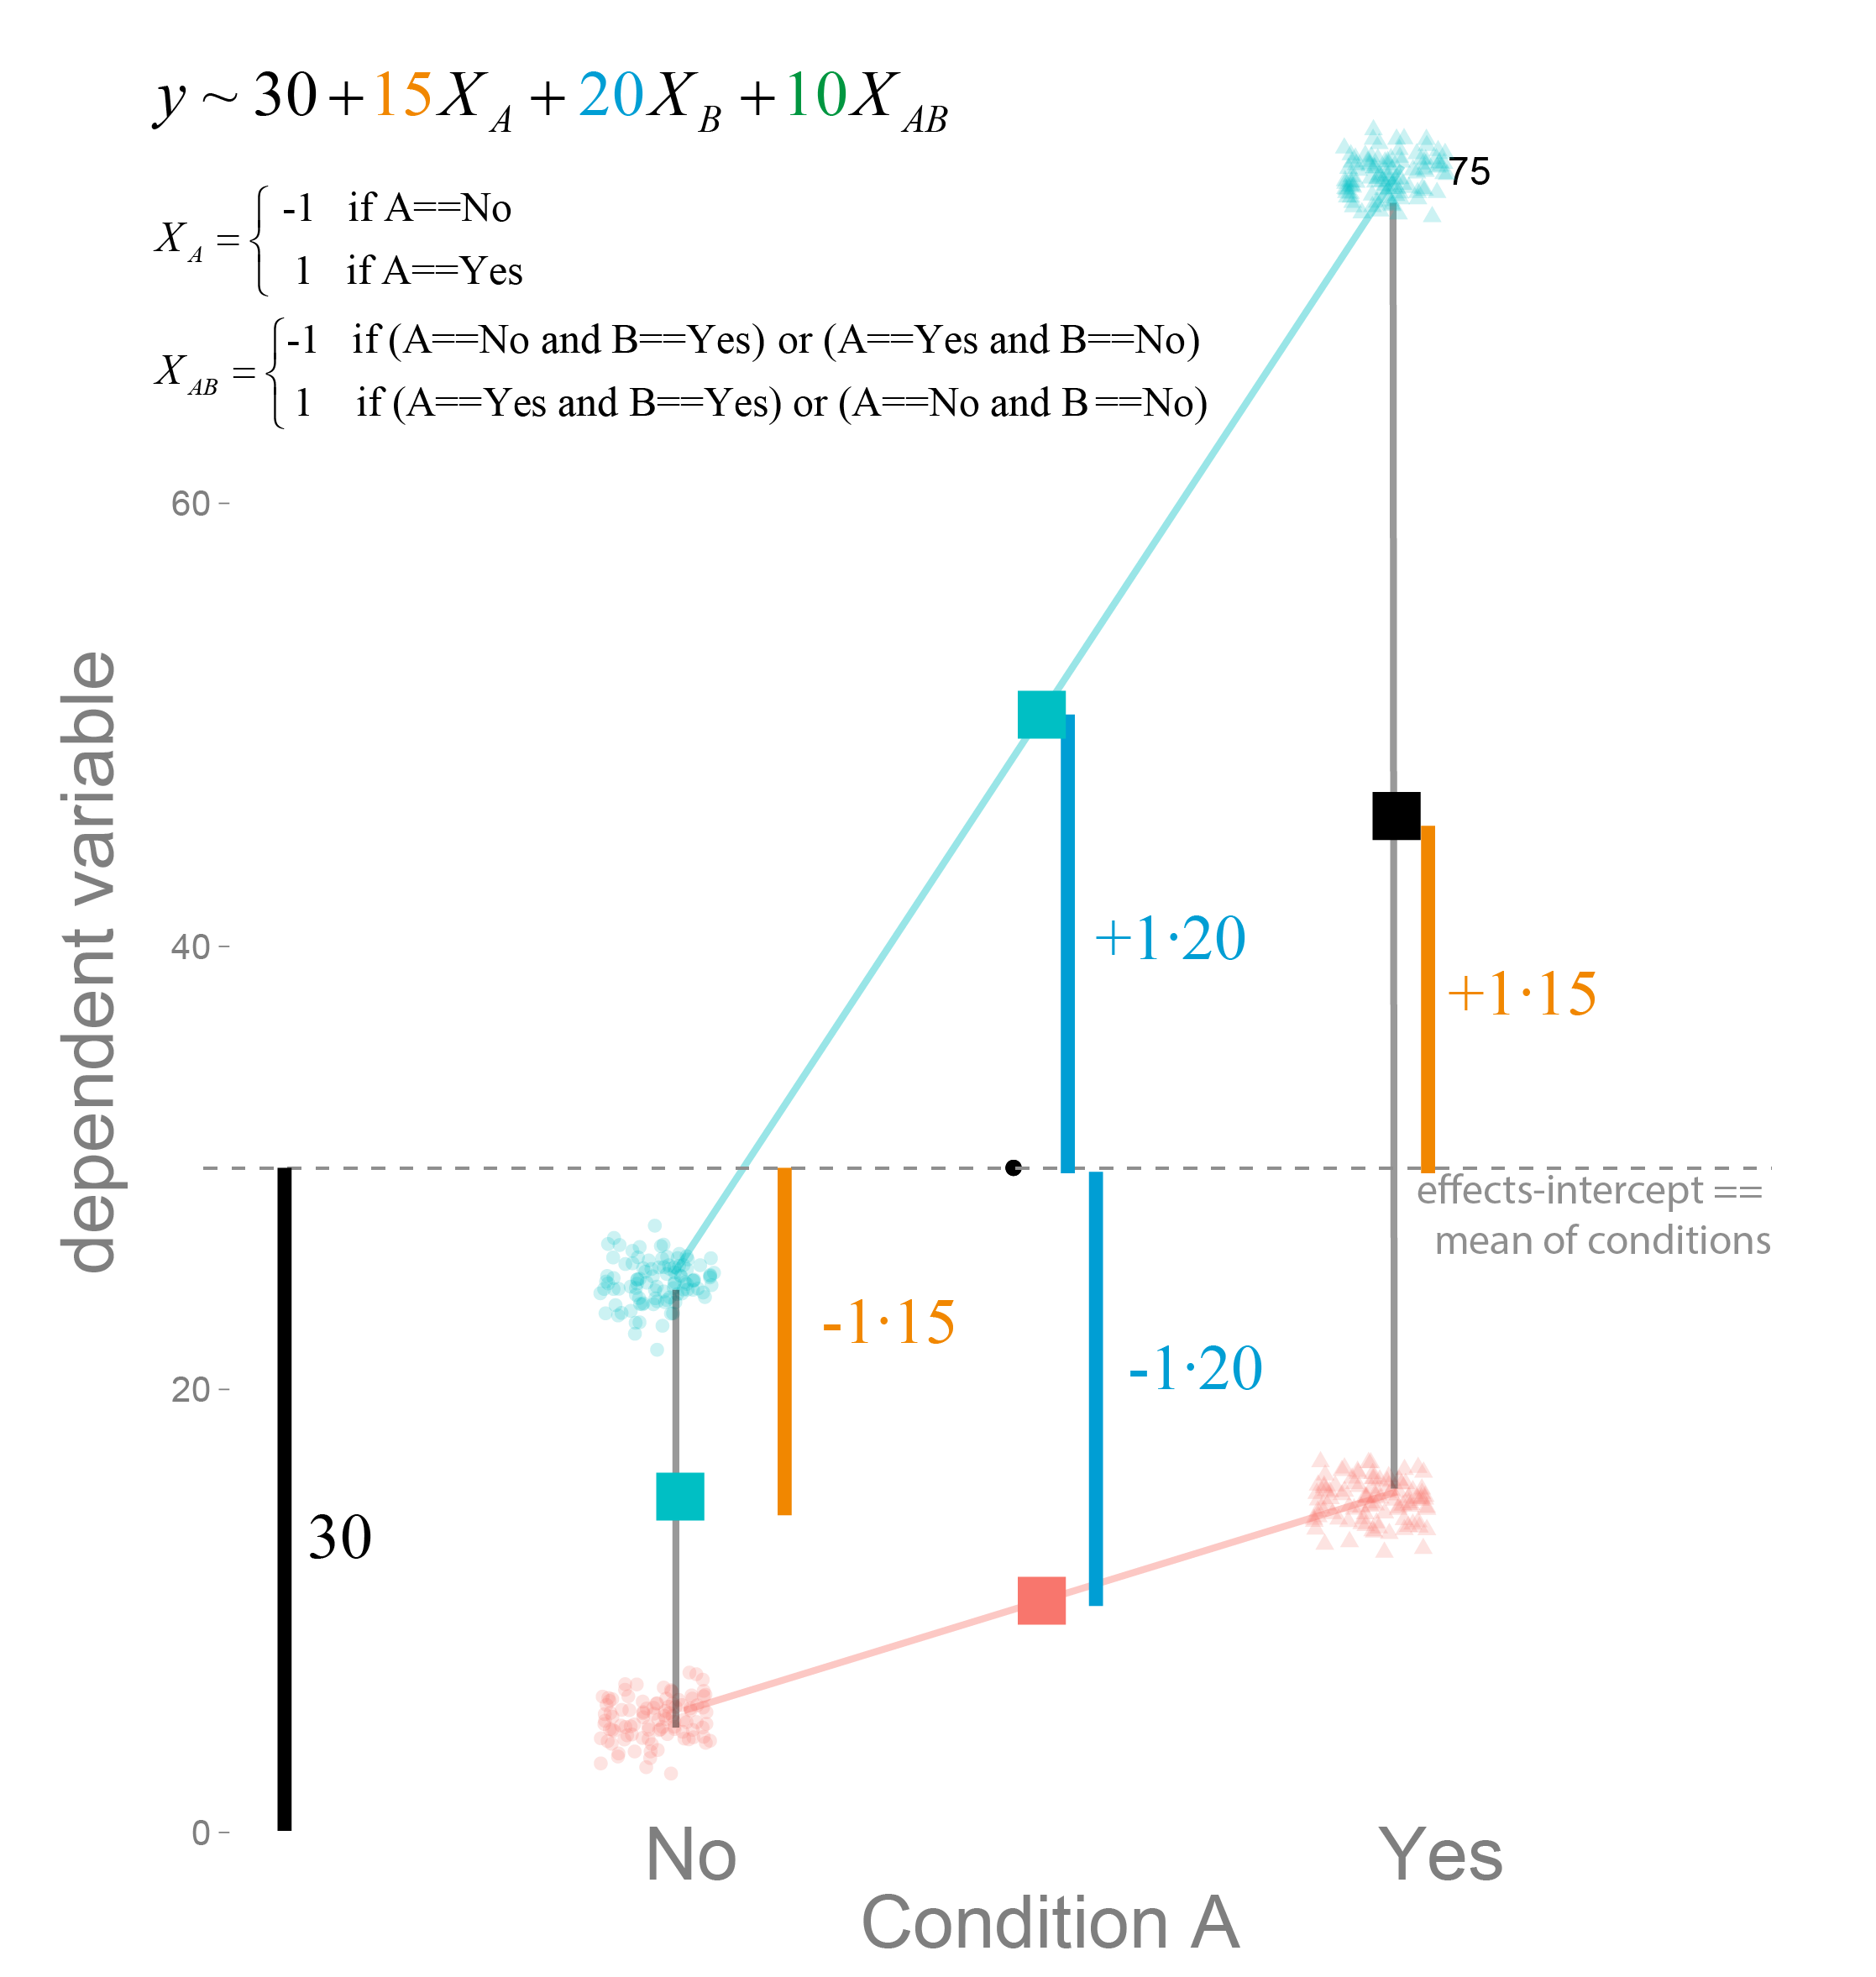
You can clearly see, that the parameter estimates are the main-effects, not the cell-means anymore. $2\cdot\beta_A $ is the main effect of A. Why $\cdot 2$? Because we coded with -1 / +1 (thus the difference e.g. the jump from -1 to 1 is 2), if we would use -0.5 / 0.5 (thus the difference is 1 as in the dummy coding above) the parameter estimate directly represents the main effects.
How do we get the cell-means from effects coding?

An example might be appropriate to better see what it means:
$$\hat{y} = \beta_0 + \beta_A X_A + \beta_B X_B + \beta_{AB} X_{AB}$$
We want to know the cell mean of B ‘yes’ if A is ‘no’. Thus $X_B = +1$ and $X_A = -1$. As written before $X_{AB}$ is the multiplication, thus $X_{AB} = X_B \cdot X_A = -1 \cdot +1 = -1$.
$${\hat{y}} = \beta_0 + \beta_A \cdot -1+ \beta_B \cdot +1 + \beta_{AB} \cdot -1$$
Intercepts
As visible in the graphs the intercepts of dummy coding represents the reference category, here the value of A=’no’ and B=’no’. The intercept of effects coding represents the mean of the conditions. This can be very different from the the total mean of the data, if you have unbalanced data:
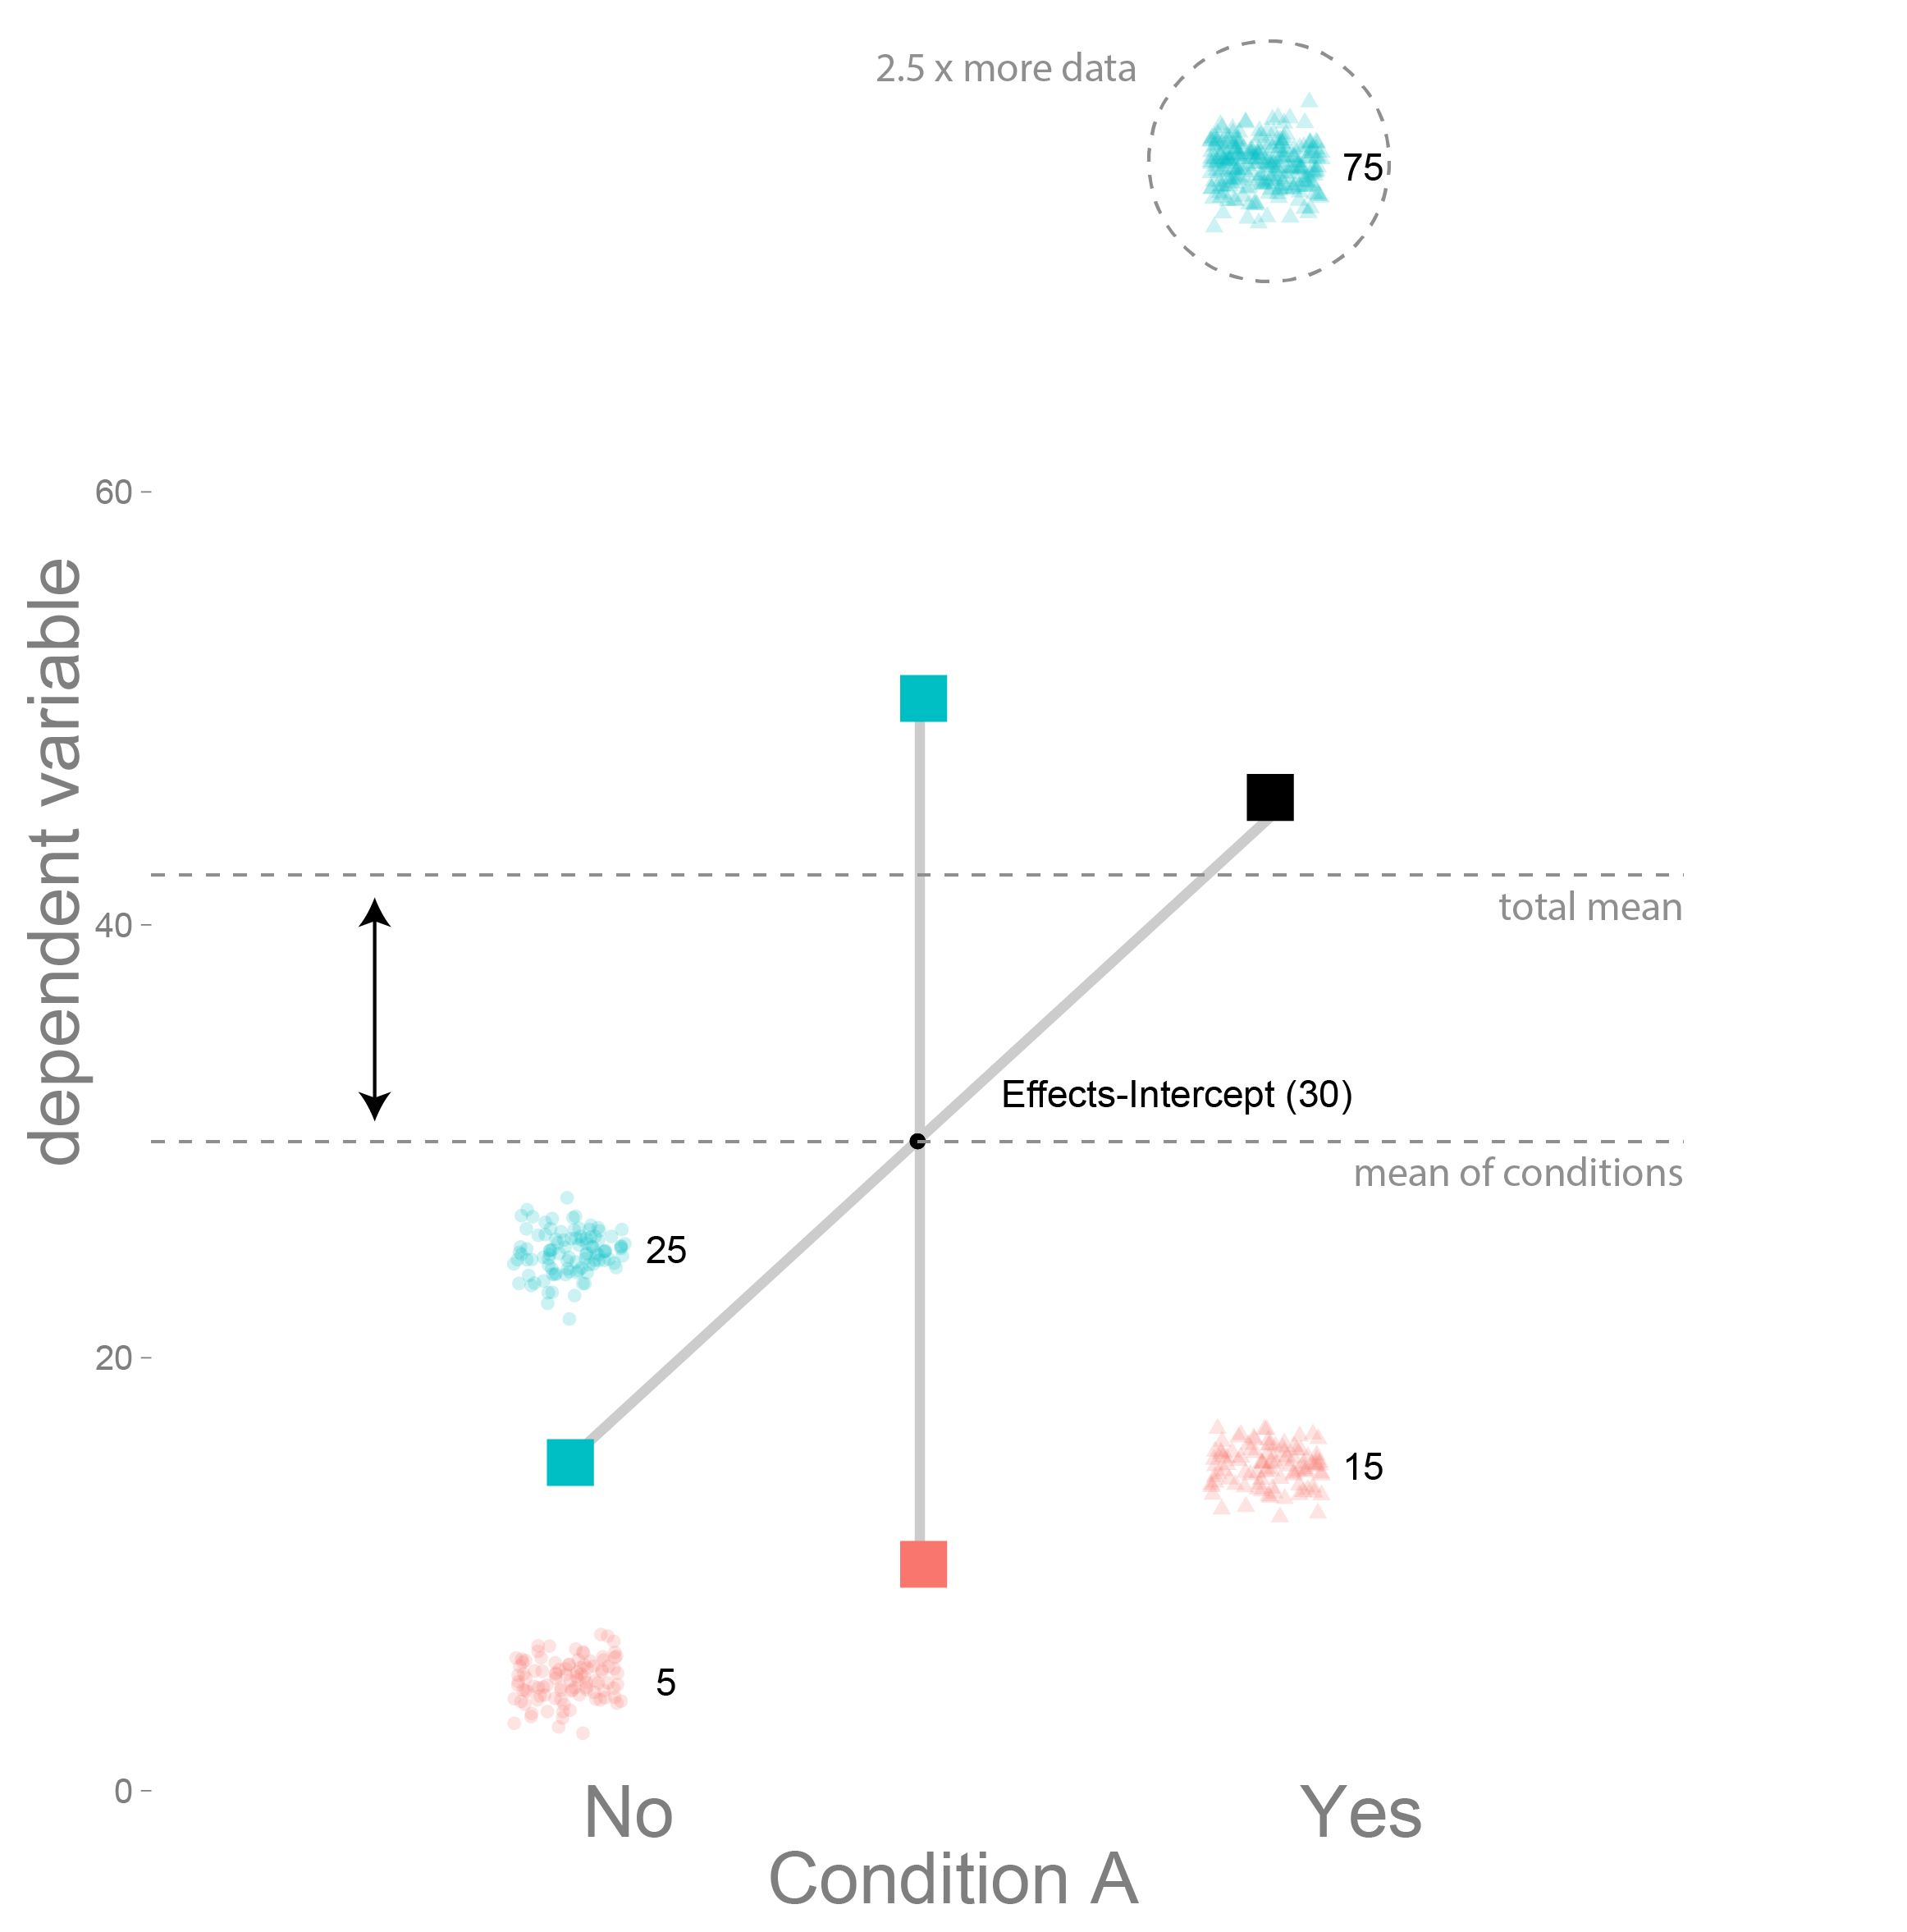
Here the A=’yes’ and B=’yes’ condition has 2.5 times more data-points, thus it moves the total-mean upwards. But the effects did not change, thus the condition means and the mean of the condition means did not change.
It is actually qiute useful, that the effects coding intercept does not represent the total mean, but the mean of condition means.
And that’s it. When should you use which? I don’t think there is a clearcut case for one or the other. It boils down to interpretation and personal preference, but some cases it is more useful to have the one and in other the other. See for example here under “why use effects coding”.
Further reading
Effect coding versus dummy coding in analysis of data from factorial experiments
A list of different coding schemes