Interaction and Effect/Sum Coding
Some time ago I wrote a blog post on dummy & effect coding. I made some new plots to visualize why the interaction in sum/effect is coded as it is.
Let’s take a typical 2×2 design. We have two 2-level factors $A$ and $B$ and we also allow for an interaction.
$$y \sim A + B + A:B$$
We code A with -1 / 1 and B with -1 / 1 (depending on the level e.g. On=1, Off=-1)
The interaction is coded as the multiplication of A and B: $A * B$. Therefore if $A$ and $B$ are both in the same level (both “off” or both “on”) we get a $+1$, else a $-1$.
Side remark: This is different in dummy/reference coding, where the interaction only codes what is extra if both A & B are “on” (turns out that the magnitude of the interaction is just double – but this is a story for another time).
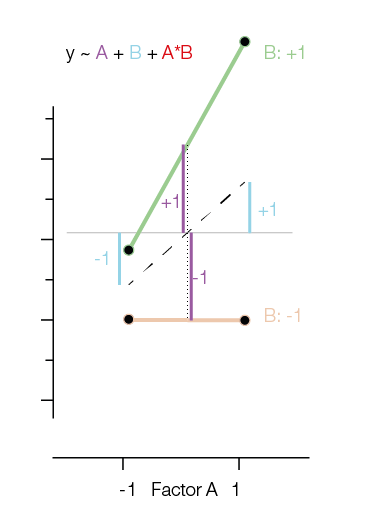
In the first figure I added the main effects of $A$ and $B$ as Blue and Purple lines. The main effects in reference coding are relative to the means of the group means.
In order to model the original data points, one needs to add the main effects and the interaction together:
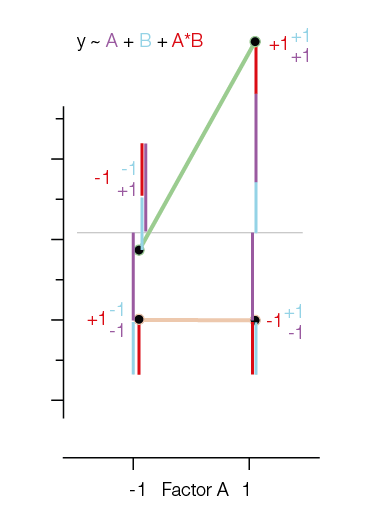
Notice that the way we have to add the interactions and main effects is exactly the multiplication I introduced earlier. That is, if we need to take -1 for $A$ and +1 for $B$, you bet we will need -1 for $A:B$.
One way that I like to think about the interaction in effect coding is to think “What would be my prediction if there would be no interaction?”.
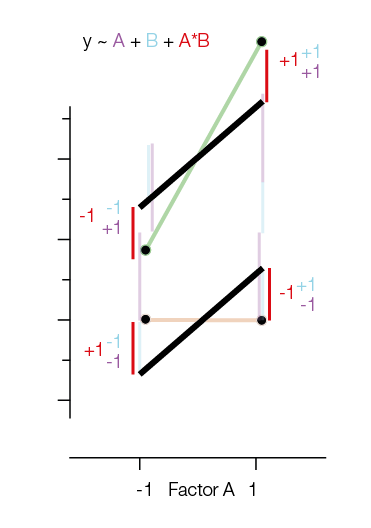
“What if there would be a model without interaction” is marked in black (it’s only using the main effects!). Note that the two black lines are parallel. Adding the red interaction-lines again helps us to move to the original datapoints.
[…] If you enjoyed reading this post, check out my sucessor post on Effect/Sum Coding […]