When the H0 distribution of TFCE is not uniform
I wrote about Threshold-Free-Cluster-Enhancement (TFCE) before, this time I stumbled upon a weirdly looking H0 diagram. Let me explain: If you simulate data without any effect, you expect that the P(data|H0) distribution is uniform, that is, all p-values are equally likely. Here, I define the p-value as the minimal p-value over time that I get from one whole simulation (1000 permutations per simulated dataset) – I simulated only cluster in time not space (find the notebook here, raw-jl here). When I did this for 100 repetitions, each applying permutation TFCE and calculating the min-p, I got the following histogram of 100 p-values:
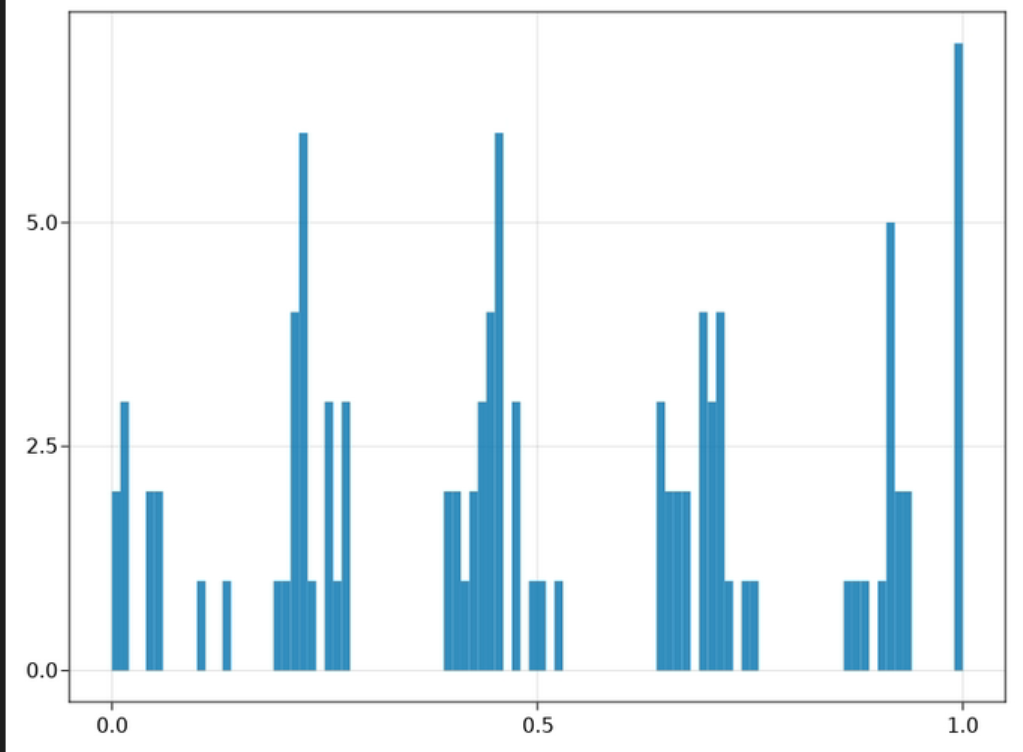
That does not look uniform at all! What is going on? It turns out, that you can get this kind of “clustering” if your integration step-size is too large. Indeed, I change the integration step from 0.4 to 0.1
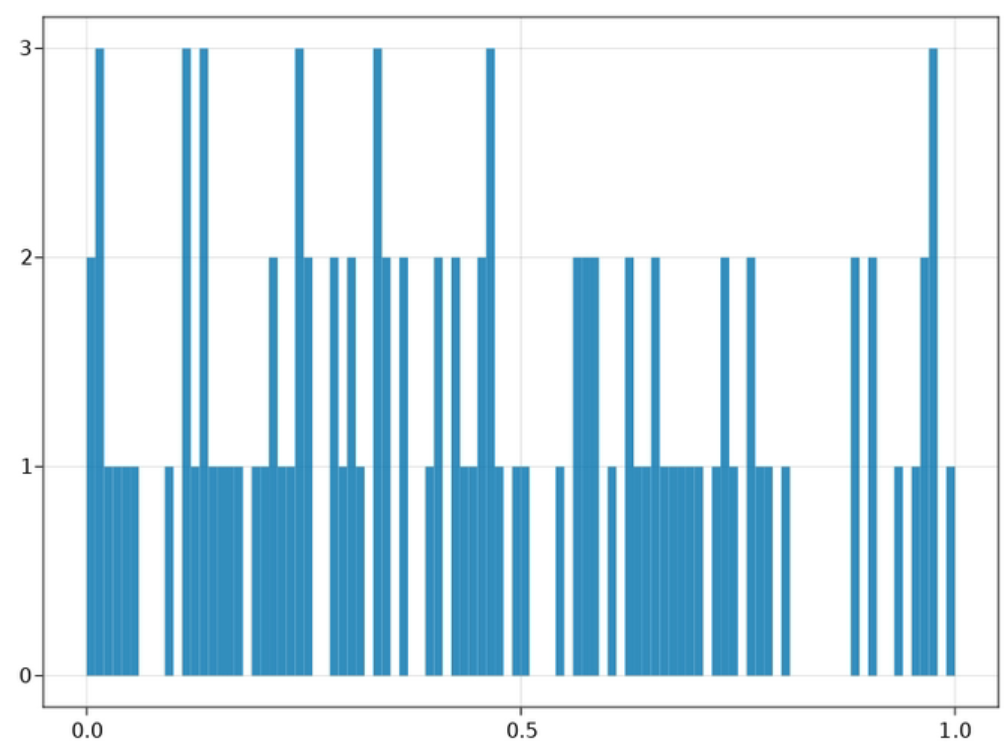
Now it looks much more uniform; I should probably use more repetitions (indeed in full simulations I use 10x as many) – but this already took 500s and I am not prepared to wait longer 😉
Thanks @Olivier Renauld for this explanation!