ICA weights and invweights
Update 01.08.2016
after further discussion we discovered that the correlation matrix was a bit off. This is because I plotted the correlation of the weights without the sphering (=whitening) step. Sphering removes the correlation between the components. I added a plot with the correlation after sphering and updated the topographies.
Goal
In EEG blind source separation using ICA, understand the difference between the mixing matrix and the unmixing matrix.
brief introduction
The blind source separation problem in the context of EEG can be understood as follows:
$$ mixing * sourceactivity = EEGdata $$
In words: We have some sources active and we know their projections on each electrode: We take the dot product (we multiply each source with its projection and add them all up).
More formally:
$$
\begin{align}
A &: mixing\\
s &: sourceactivity\\
x &: EEGdata \\
A * s &= x\\
\end{align}
$$
Because every neuronal source projects to most (or even all) sensors/electrodes, the original brain-source activation can only be recored in a mixed way.
Thus in order to unmix we can use blind source separation (ICA details can be found here)
$$
\begin{align}
W &: unmixing \\
unmixing * EEG.data &= sourceactivity \\
W * x &= s \\
\end{align}
$$
The relation between mixing and unmixing matrix in ICA (and other BSS methods) is:
$$
\begin{align}
A * s & = x\\
A^{-1} * A * s & = A^{-1} * x\\
s & = A^{-1} * x\\
A^{-1}& = W\\
\end{align}
$$
This is only true if $A$ is invertible and square (if non-square you have to use a pseudoinverse, see the Haufe 2014 paper for more information)
The matrix $W$ is also known as the extraction filter
The matrix $A$ is also know as the activity pattern
EEG ICAs
In eeglab the default infomax-ICA algorithm uses a sphering (whitening) step before calculating the weights. Thus the following relation is true:
[code lang=text] EEG.icawinv = pinv( EEG.icaweights * EEG.icasphere) % the mixing matrix, channels x sourcesEEG.icaact = EEG.icaweights*EEG.icasphere)*EEG.data % the activation, sources x time
[/code]
This is how ICA components look, on the left the weights after sphering-preprocessing, middle the unmixing matrix and on the right the mixing matrix. Usually we should look at the mixing matrix ($A = W^{-1}$).
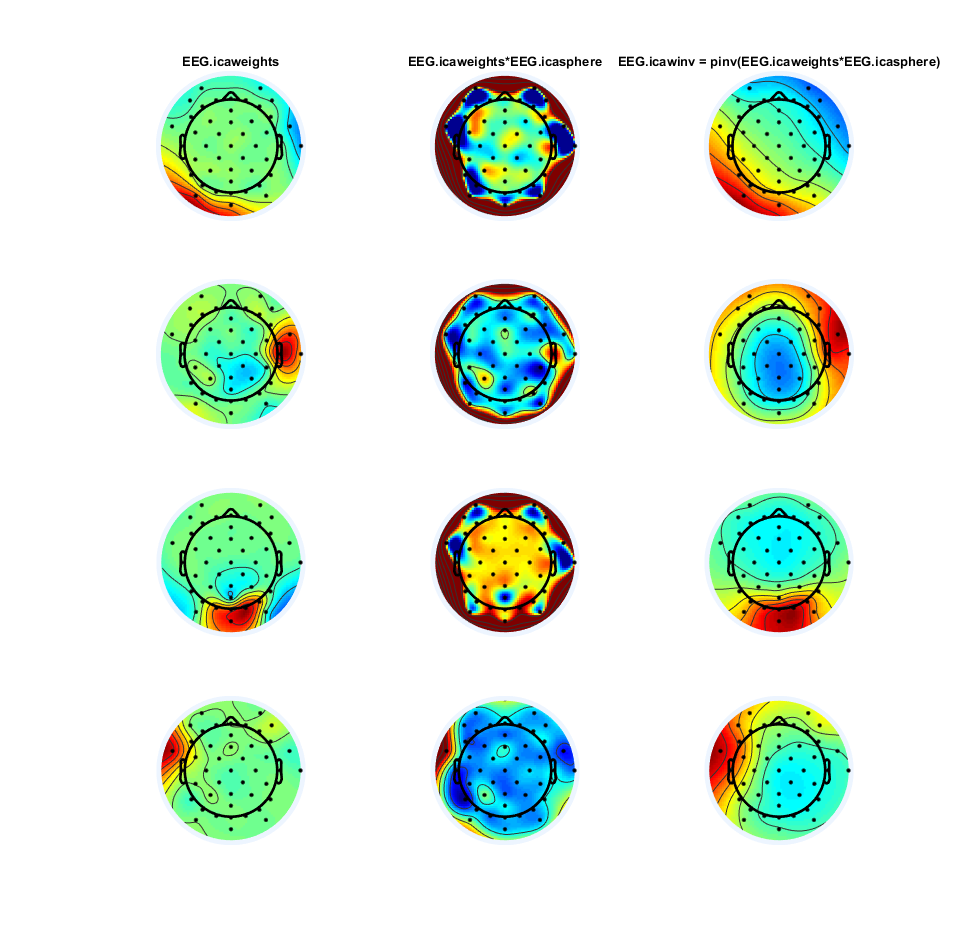
The weights after decorrelation (=sphering) seem to be quite similar, but the unmixing ($W$) looks very different and is actually very hard to interprete!
One interesting thing to look at is the correlation between the component-vectors (in this case 32 components). As we can see here:
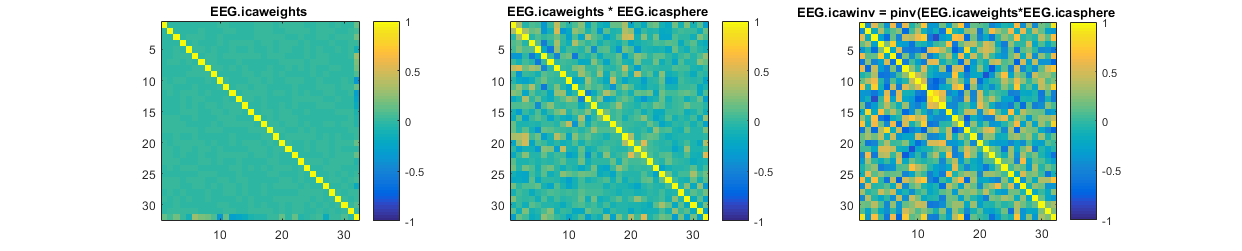
Note that the correlation of the EEG.icaweight matrix is 0 because it is a pure rotation matrix (which is orthognal, thus correlations of 0). As explained here the whitening step estimates the stretching and thus only a rotation remains for the EEG.icaweight matrix.
More information
Haufe et. al. 2014(pdf-openaccess-link) have a very nice paper around this issue.
TLDR; Don’t look at your filter/unmixing matrix.
Thanks to
Holger Finger, Anna Lisa Gert, Tim Kietzmann,Peter König, Andrew Melnik ( in alphabetical order) for discussions.
01-2023: Thanks to Fabiano Baroni for noticing I had $$W$$ & $$A$$ switched up throughout the blog post!!
“Usually we should look at the mixing matrix (A=W−1).” The mixing matrix is W.
“but the unmixing (W) looks very different and is actually very hard to interprete!” The unmixing is W^-1
Thanks for the comment, this is fixed!