Visualization of deconvolution with pluto.jl
I just started dabbling with Pluto.jl and very quickly it allows to give very insightful notebooks.
For example, take this signal:
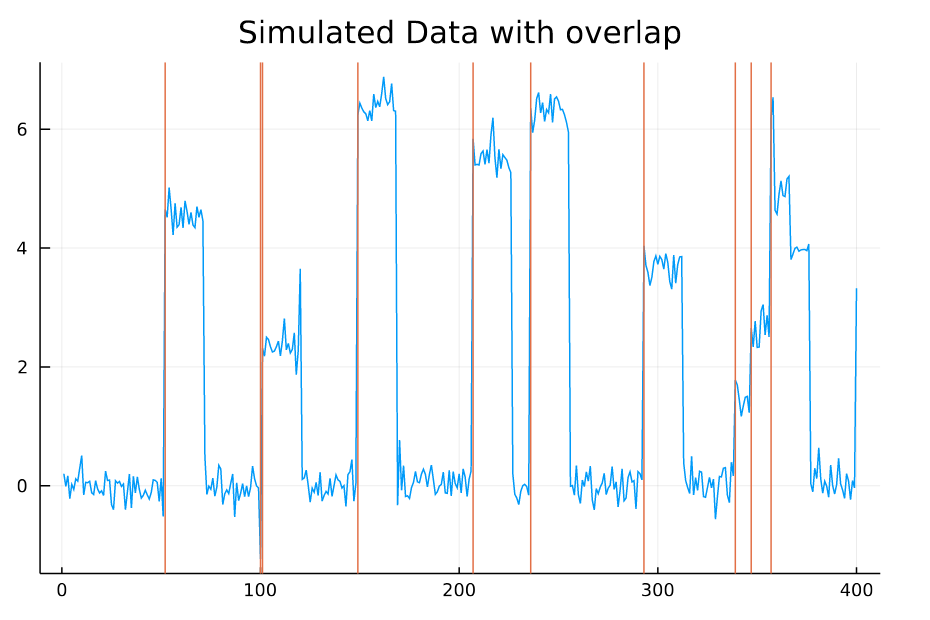
Clearly, the simulated event-responses (the event-related potentials) overlap in time (e.g. at ~sample 350). We could do a “naive” regression on all timepoints relative to the event-onset, ignoring any overlap – or we could use linear deconvolution aka. overlap-correction to correct for the overlap (as the name says ;).
What follows is the beauty of Pluto.jl – simple reactive/interactive notebooks. As shown in the following gif, it is very easy to show the dependency of deconvolution-success on window-size and noise:

Looks pretty robust for this simulation! Cool!
If you want to try for yourself: here is the notebook and here the link to the Unfold.jl toolbox