Statistics: Cluster Permutation Test
I sometimes give improvised lectures to a small circle of students. These are some of the explanations I use.
The goal
Find time-points in a time series that differ between two conditions over subjects without performing single independent tests for each time-point.
Step by Step Guide
In this tutorial, we apply the cluster-permutation test to a single time-series. This could be a single channel, an average over channels, or one “source/component” from an ICA decomposition.
We can make use of the neighbour-relation of time: $t$ has the neighbors $t-1$ and $t+1$. We don’t expect the time points to be independent, but that they have a relationship which we can exploit (for multi-channel data, we could include the neighbour-relation between channels as well, but let’s not get ahead of ourselves).
In our example we use ICA component activation because a) this was the student’s problem, b) we do not need to take into account several channels which were recorded at the same time (but we could!). Of course the algorithm is independent of the signal: We could use ERPs, Bandpass-Filtered-Frequency Amplitudes, Image-Pixel-Grayvalues or many others.
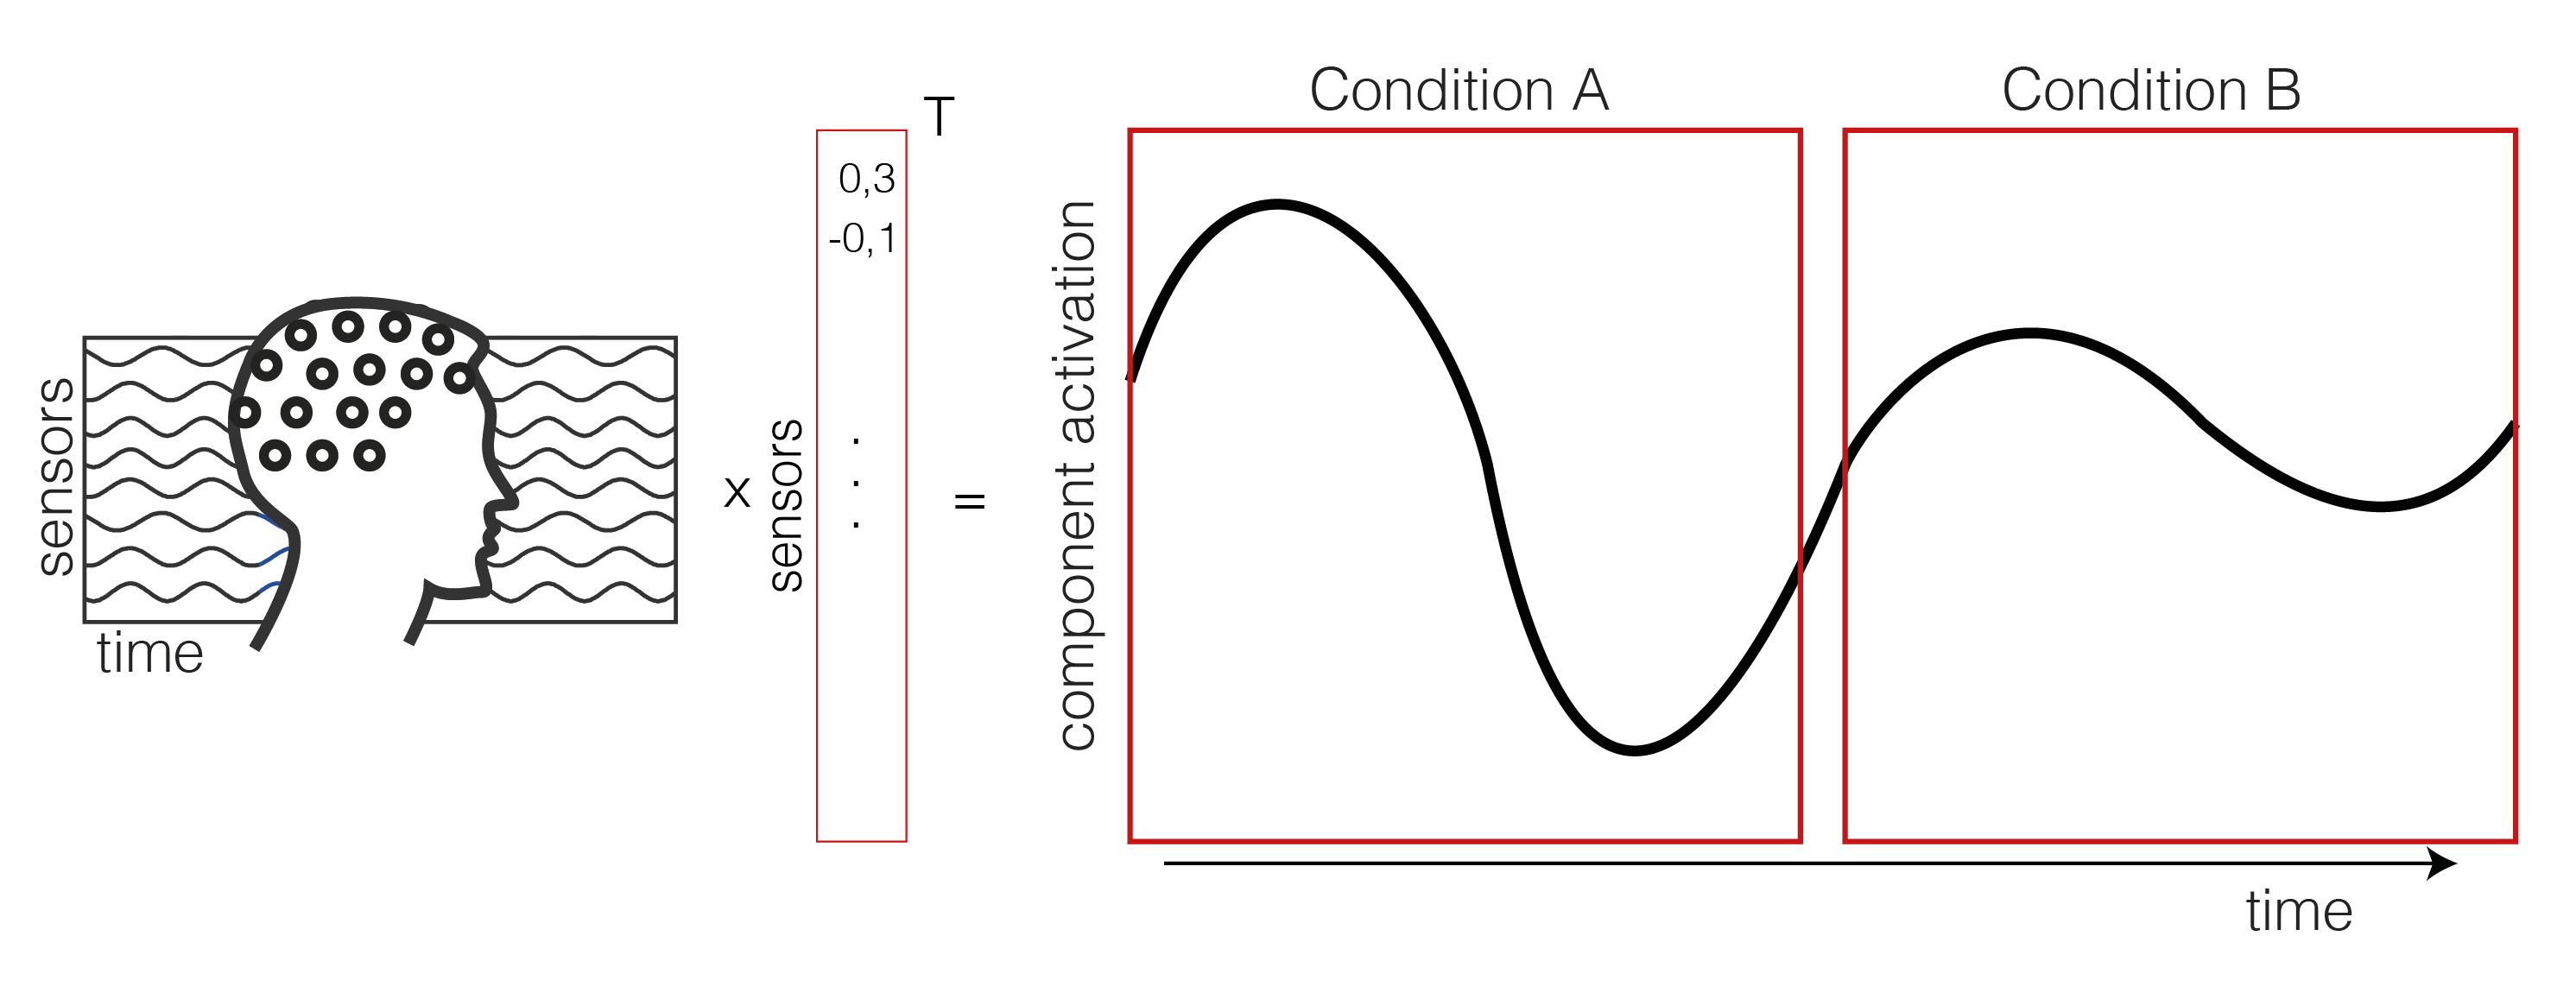
1. Extract the component activation over time
We take the EEG data (time x sensor) and multiply it with a mixing matrix (the component map we extracted through ICA). We receive a one dimensional IC activation profile over time. In our case, we have trials of two conditions (A and B) shown as a continuous signal (only one trial of each condition is shown here, usually you have more than two trials).
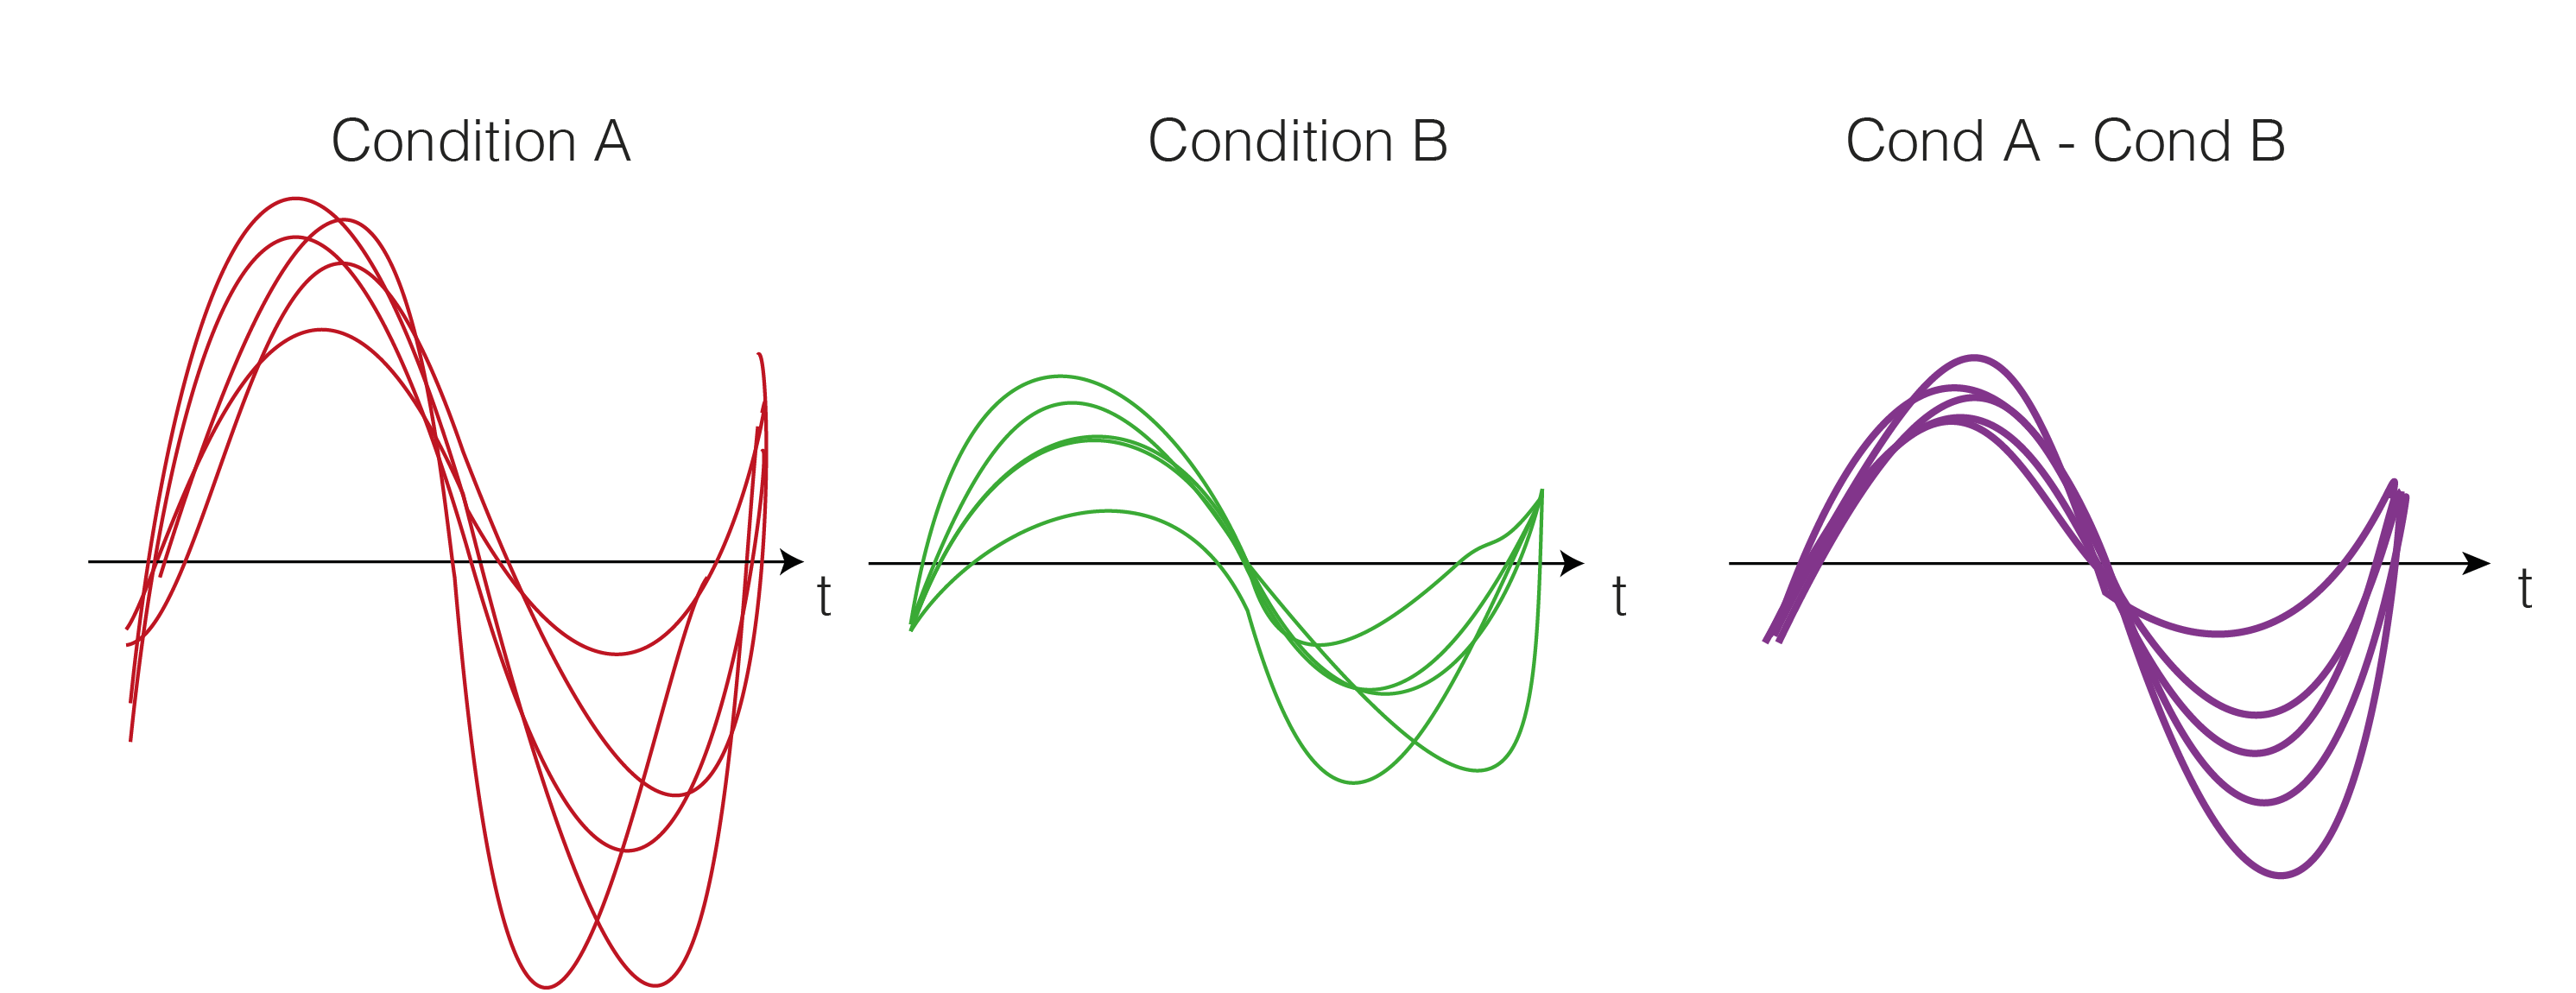
2. Get the trials for multiple subjects
Repeat Step 1. for each subject. We calculate the difference between the two conditions A and B (a within subject comparison). Thus, we get difference values for each subject over time (purple).
3. Test-Statistics (T-Value)
As a test statistics, we could use the mean, but we prefer the t-statistic because it punishes high variance between subjects. t-values are defined by:
$$t = \frac{\bar{x}}{\frac{\sigma}{sqrt(n)}}$$
Where $t$ is the t-value, $\bar{x}$ is the mean difference, $\sigma$ the standard deviation and $n$ the number of subjects. Intuitively, the more subjects we have or the bigger the difference (marked in blue), the bigger the t-value. The smaller the variance, the bigger the t-value (marked in green). Very colloquial: a scale-free measure of how sure we are there is an effect.
A visual help is in the next figure.

4. Clusters over time
We would rather not do a statistical test for each time-point individually because we would need to correct for multiple comparison for all time points. Instead, we use a trick: Let’s define clusters by an arbitrary threshold and test whether these clusters are larger clusters that occur by chance.
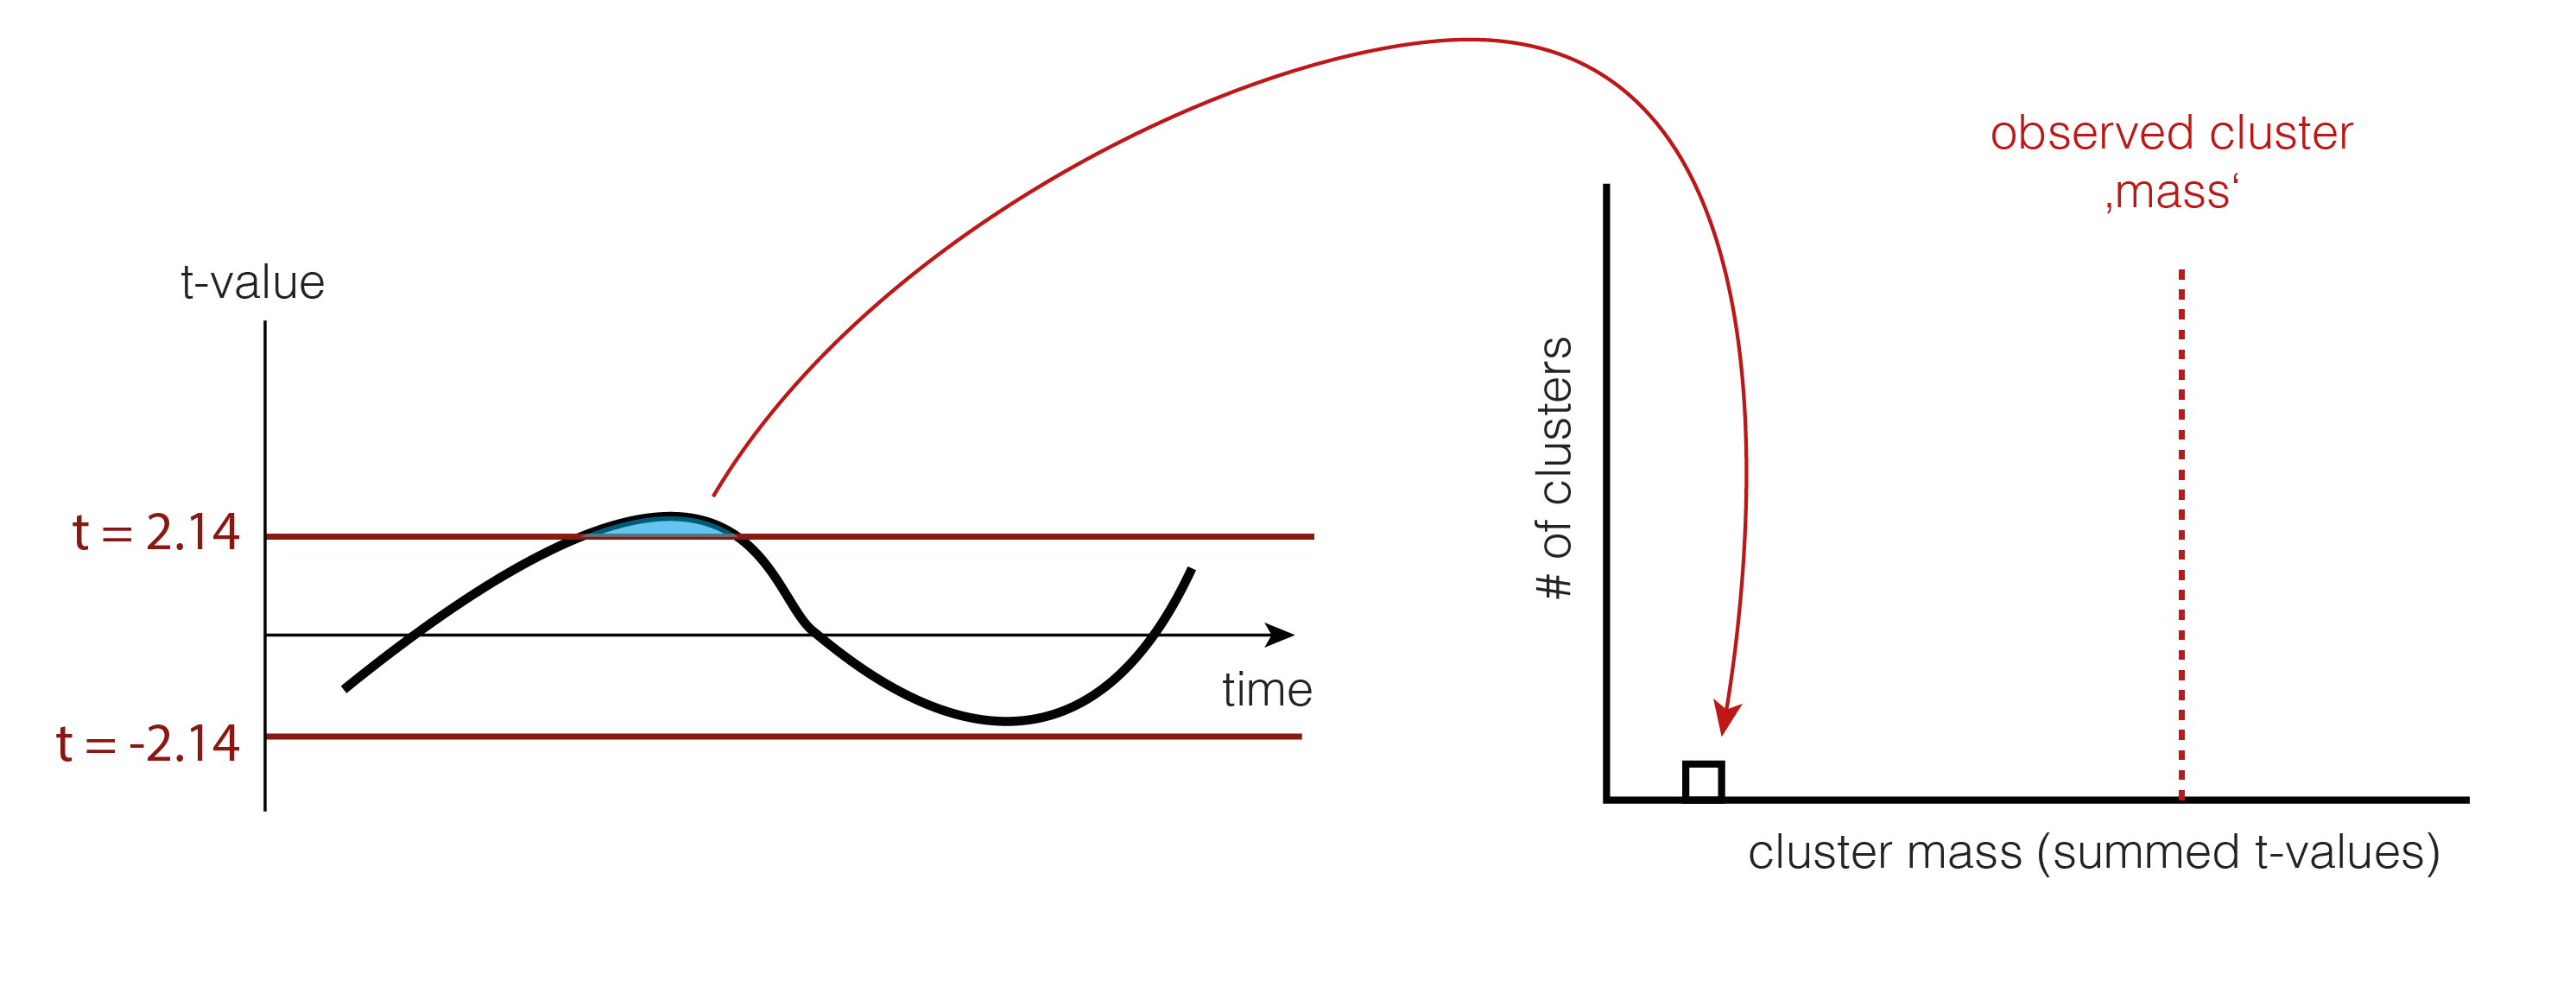
The arbitrary threshold we use is at p=0.05 (which directly corresponds to two t-values when given the number of subjects, e.g. for 15 subjects the t-values corresponding to p=0.05 are 2.14 and -2.14). In our example, this leads to a single positive cluster, but of course, multiple cluster of different sizes could have formed depending on the IC activation over time.
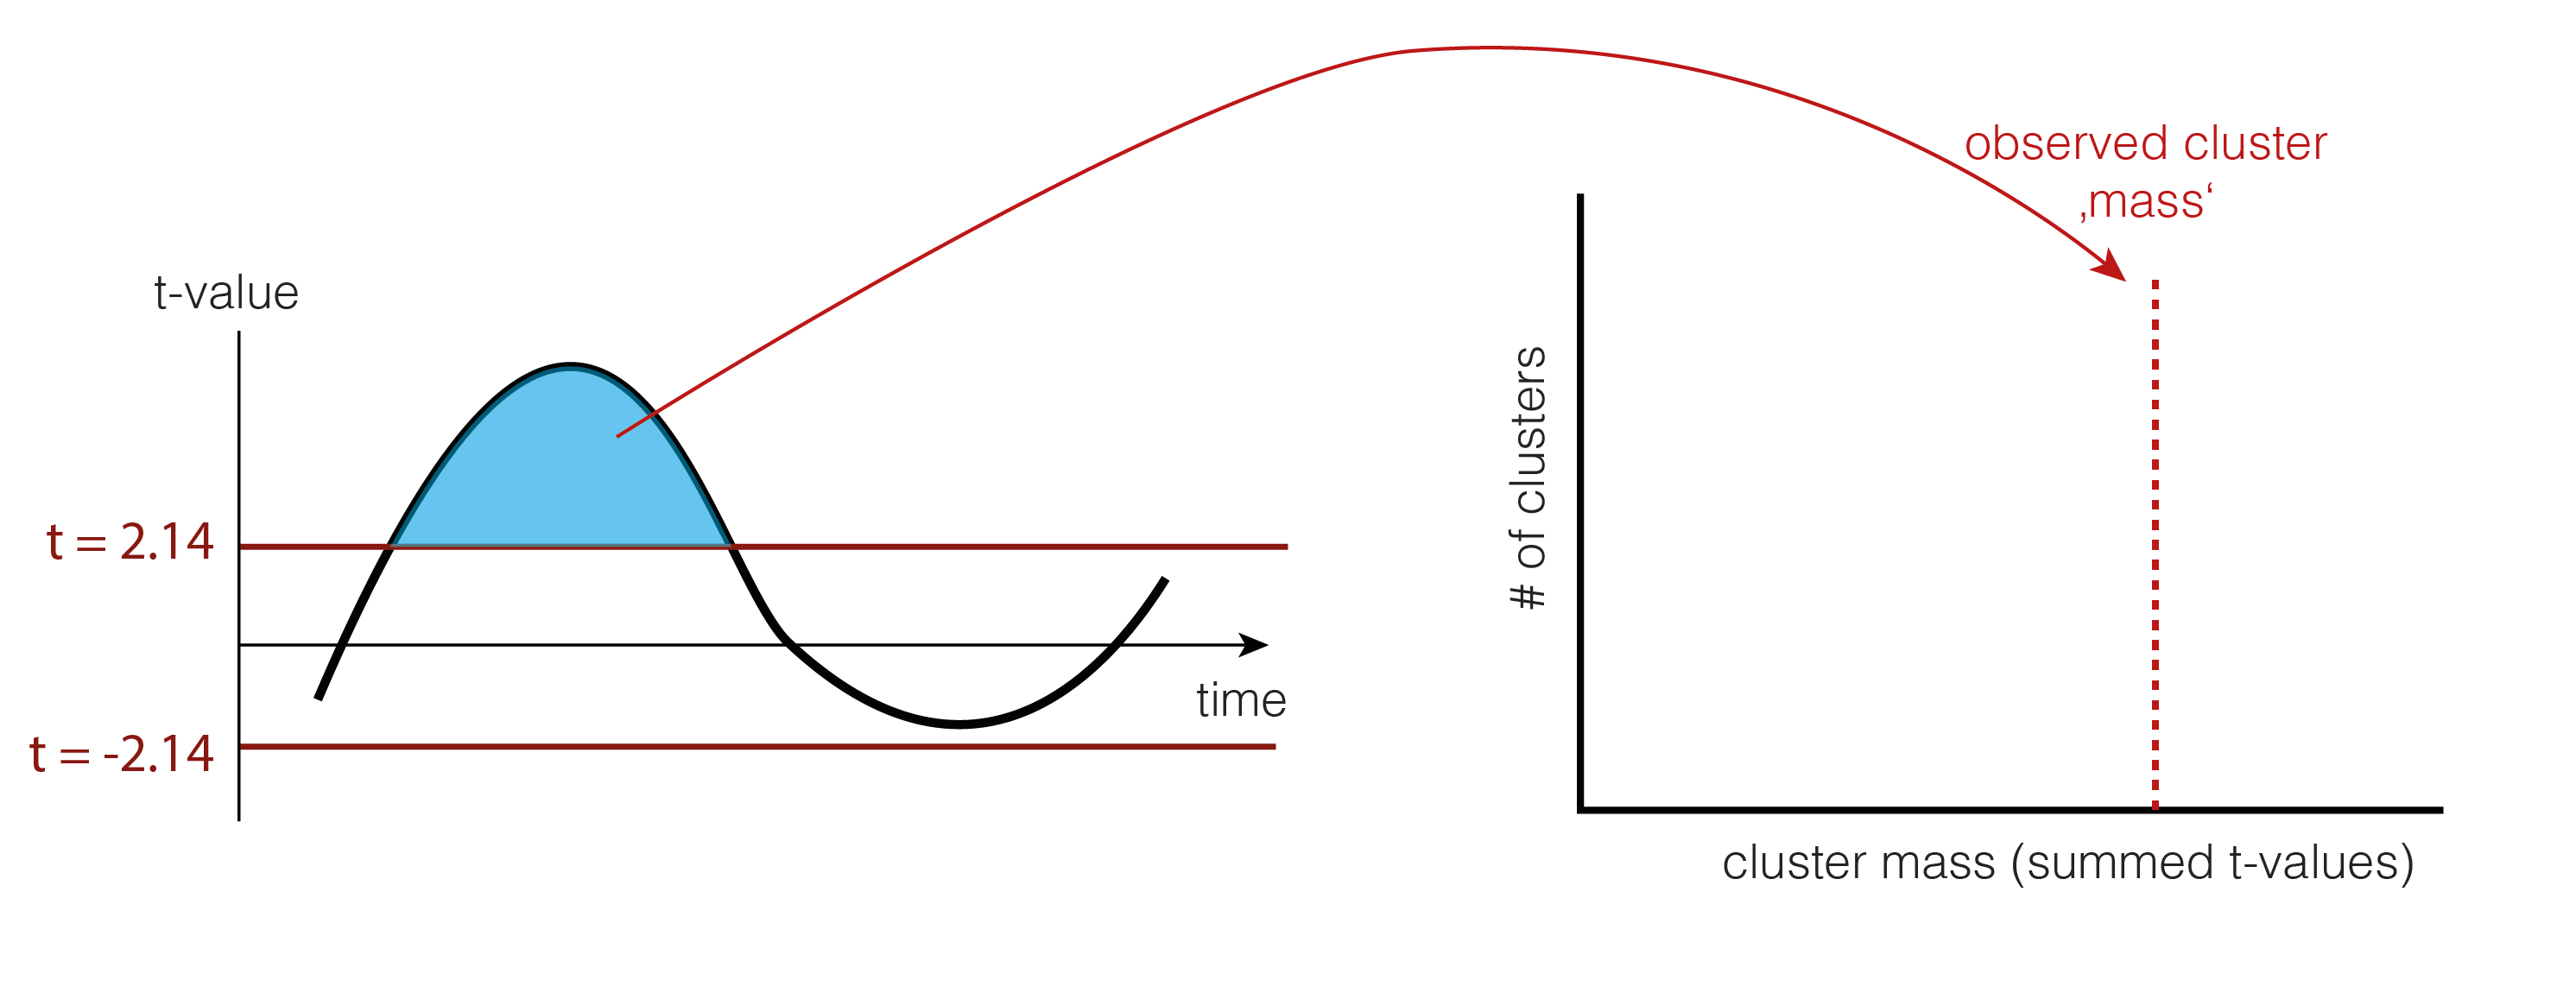
As a statistic, we could use the number of samples the cluster extends, the summed t-value, or many other statistics. We use cluster-mass, which is the sum of the t-values.
5. Permutation of data
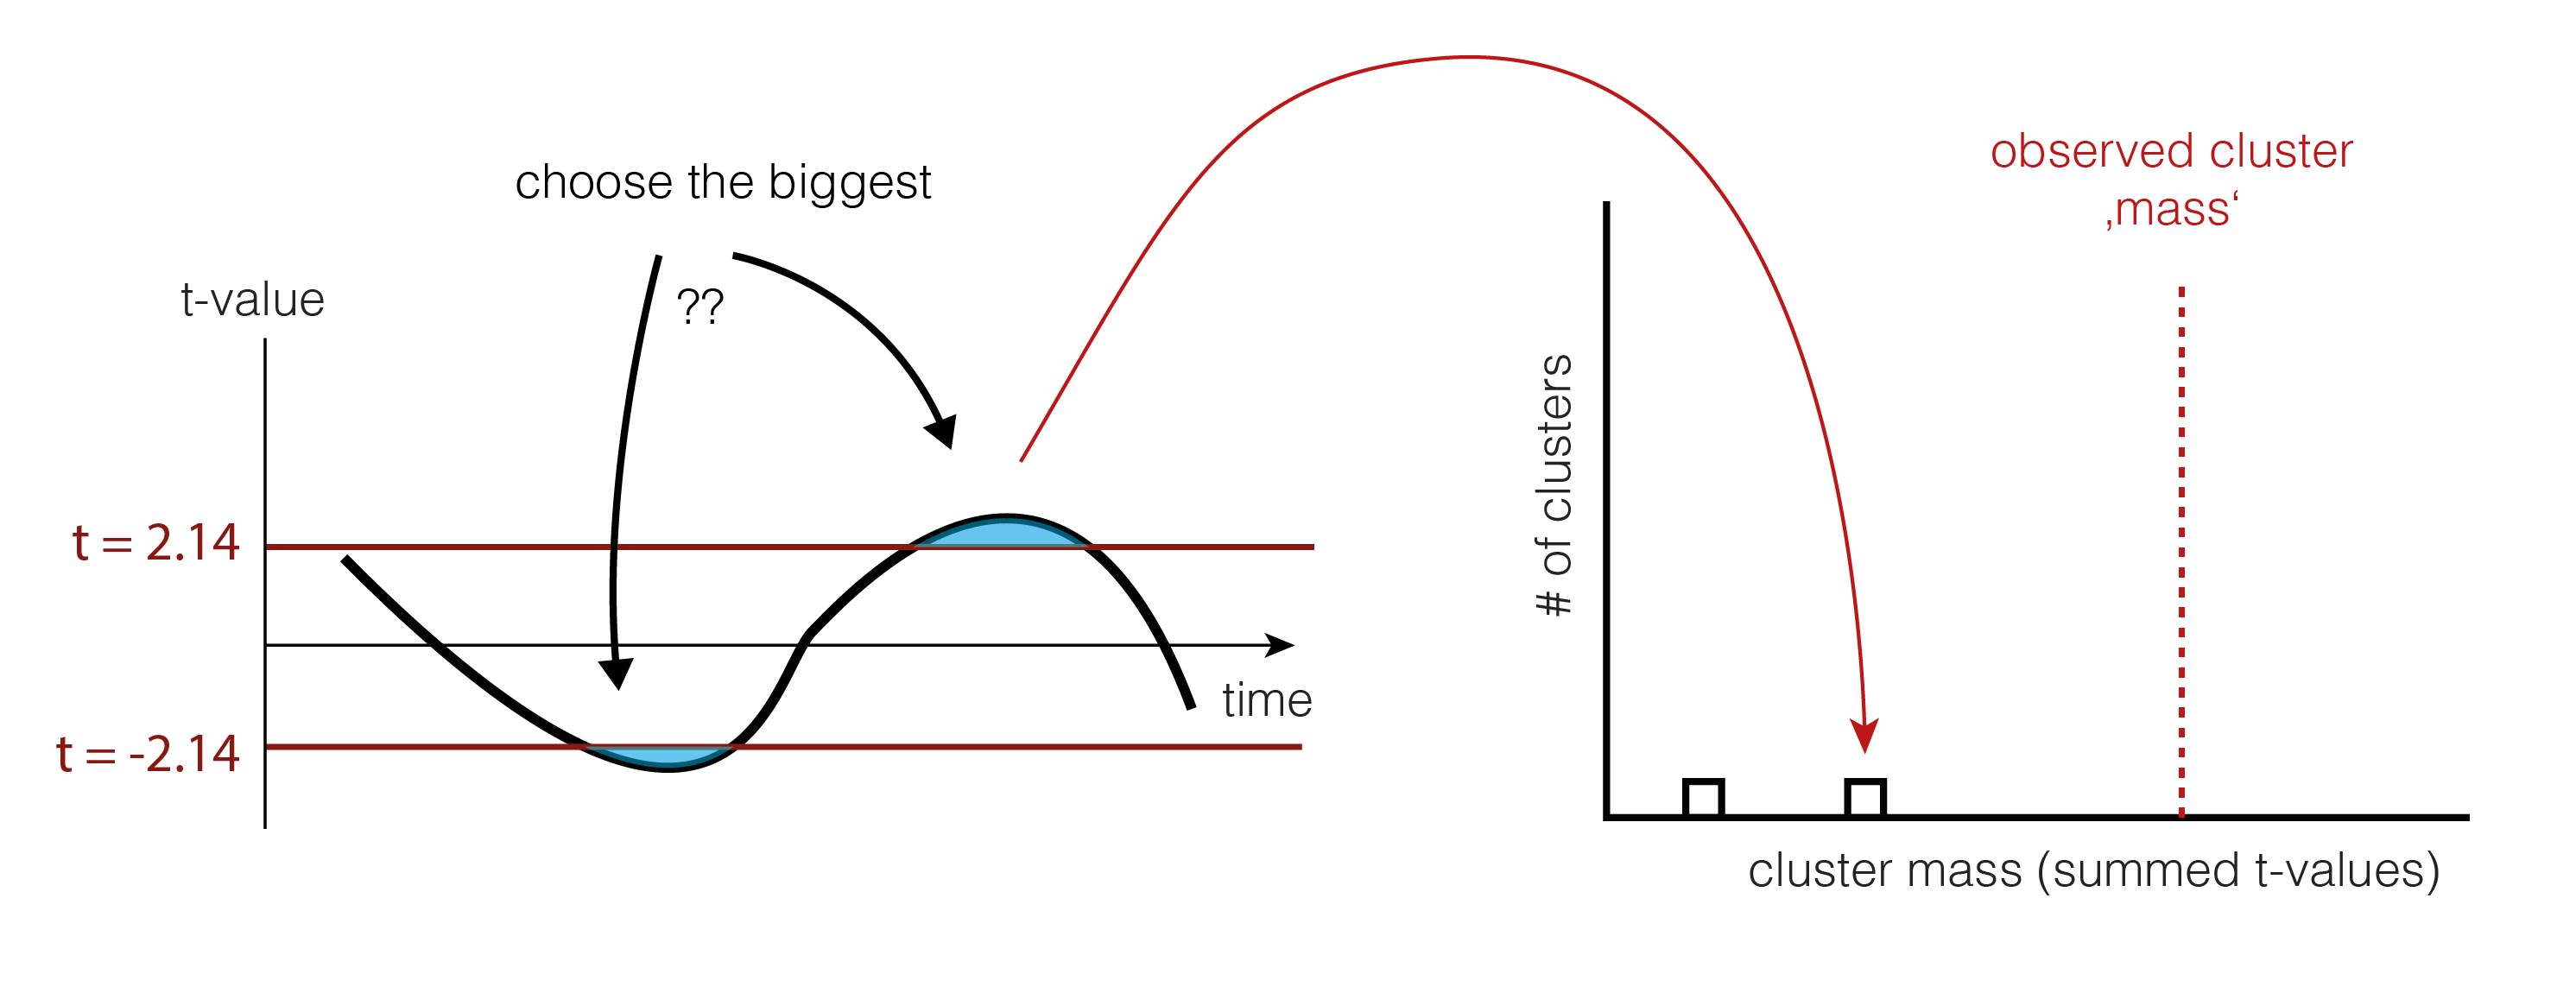
We now want to estimate how big clusters would be, if there would be no differences between the conditions A and B. This would mean that the clusters formed just by chance (this is our $H_0$ distribution of cluster sizes). To do this, we shuffle the condition-label for each subject. The idea is that if there is no difference between the conditions, the labels are meaningless and therefore shuffling them would yield similar results as before. Note that they are similar, not identical. We thus try to estimate how big the variability of these similar results are, and whether our observed value falls into the variability, or whether i is special.
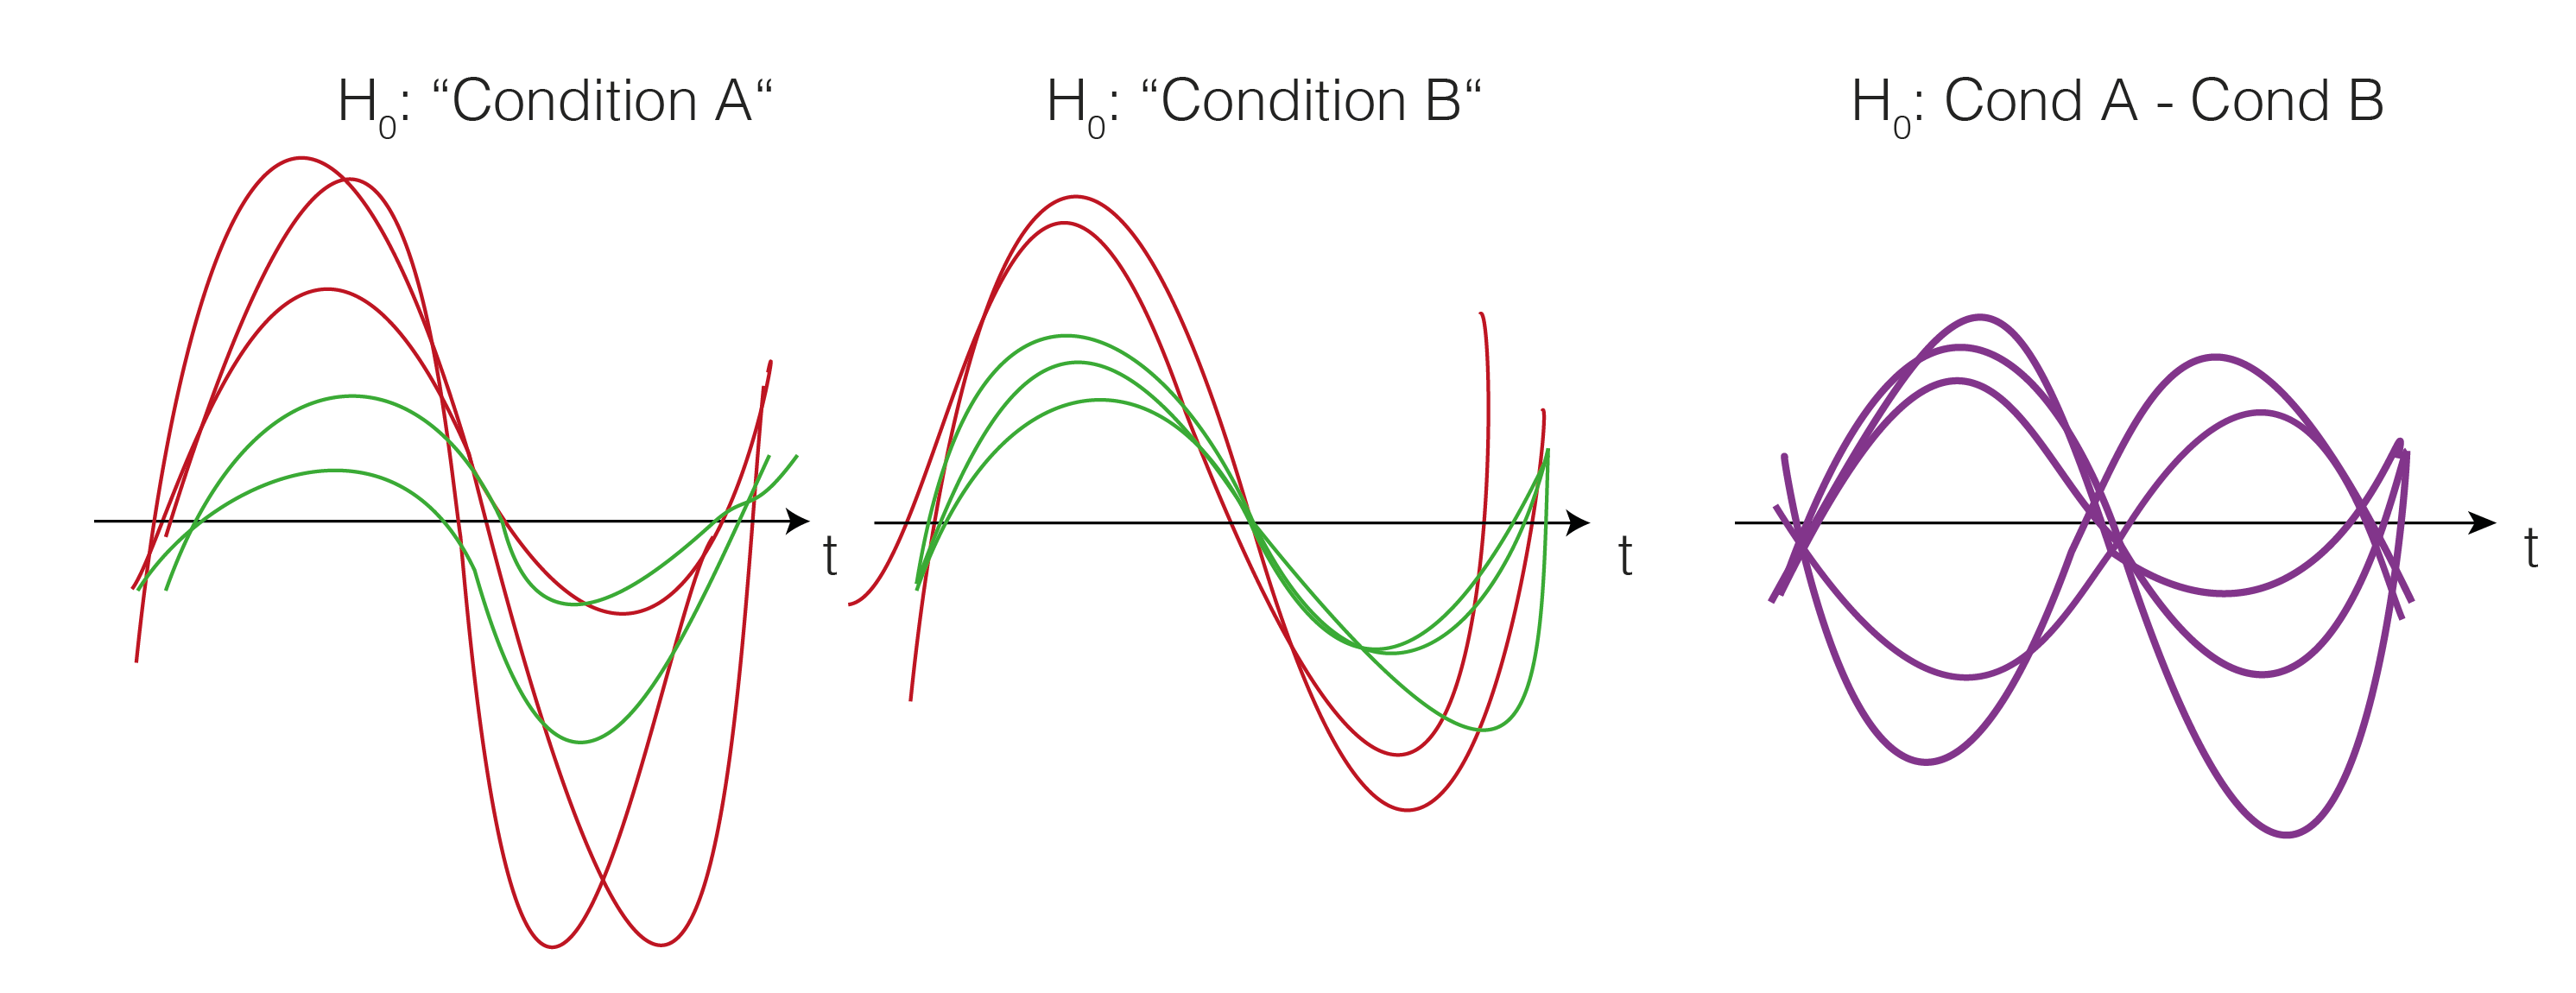
Note that we actually do not need to go back to the two conditions, but we could just flip (multiply by -1) randomly every subject-difference curve.
So we shuffle and calculate the cluster size.
And shuffle and calculate the cluster size(s) again (take the largest one if there are multiple)
6. Check the tail
We now check whether our observed cluster mass ( Step 4.) is greater than 95% of what we would expect by chance ( Step 5. ). The exact value gives us the p-value of the cluster, the probability that cluster-mass with the observed (or more extreme) size would have occurred when there was no actually difference between the conditions. If we had initially observed multiple clusters, we can check each against the same distribution.
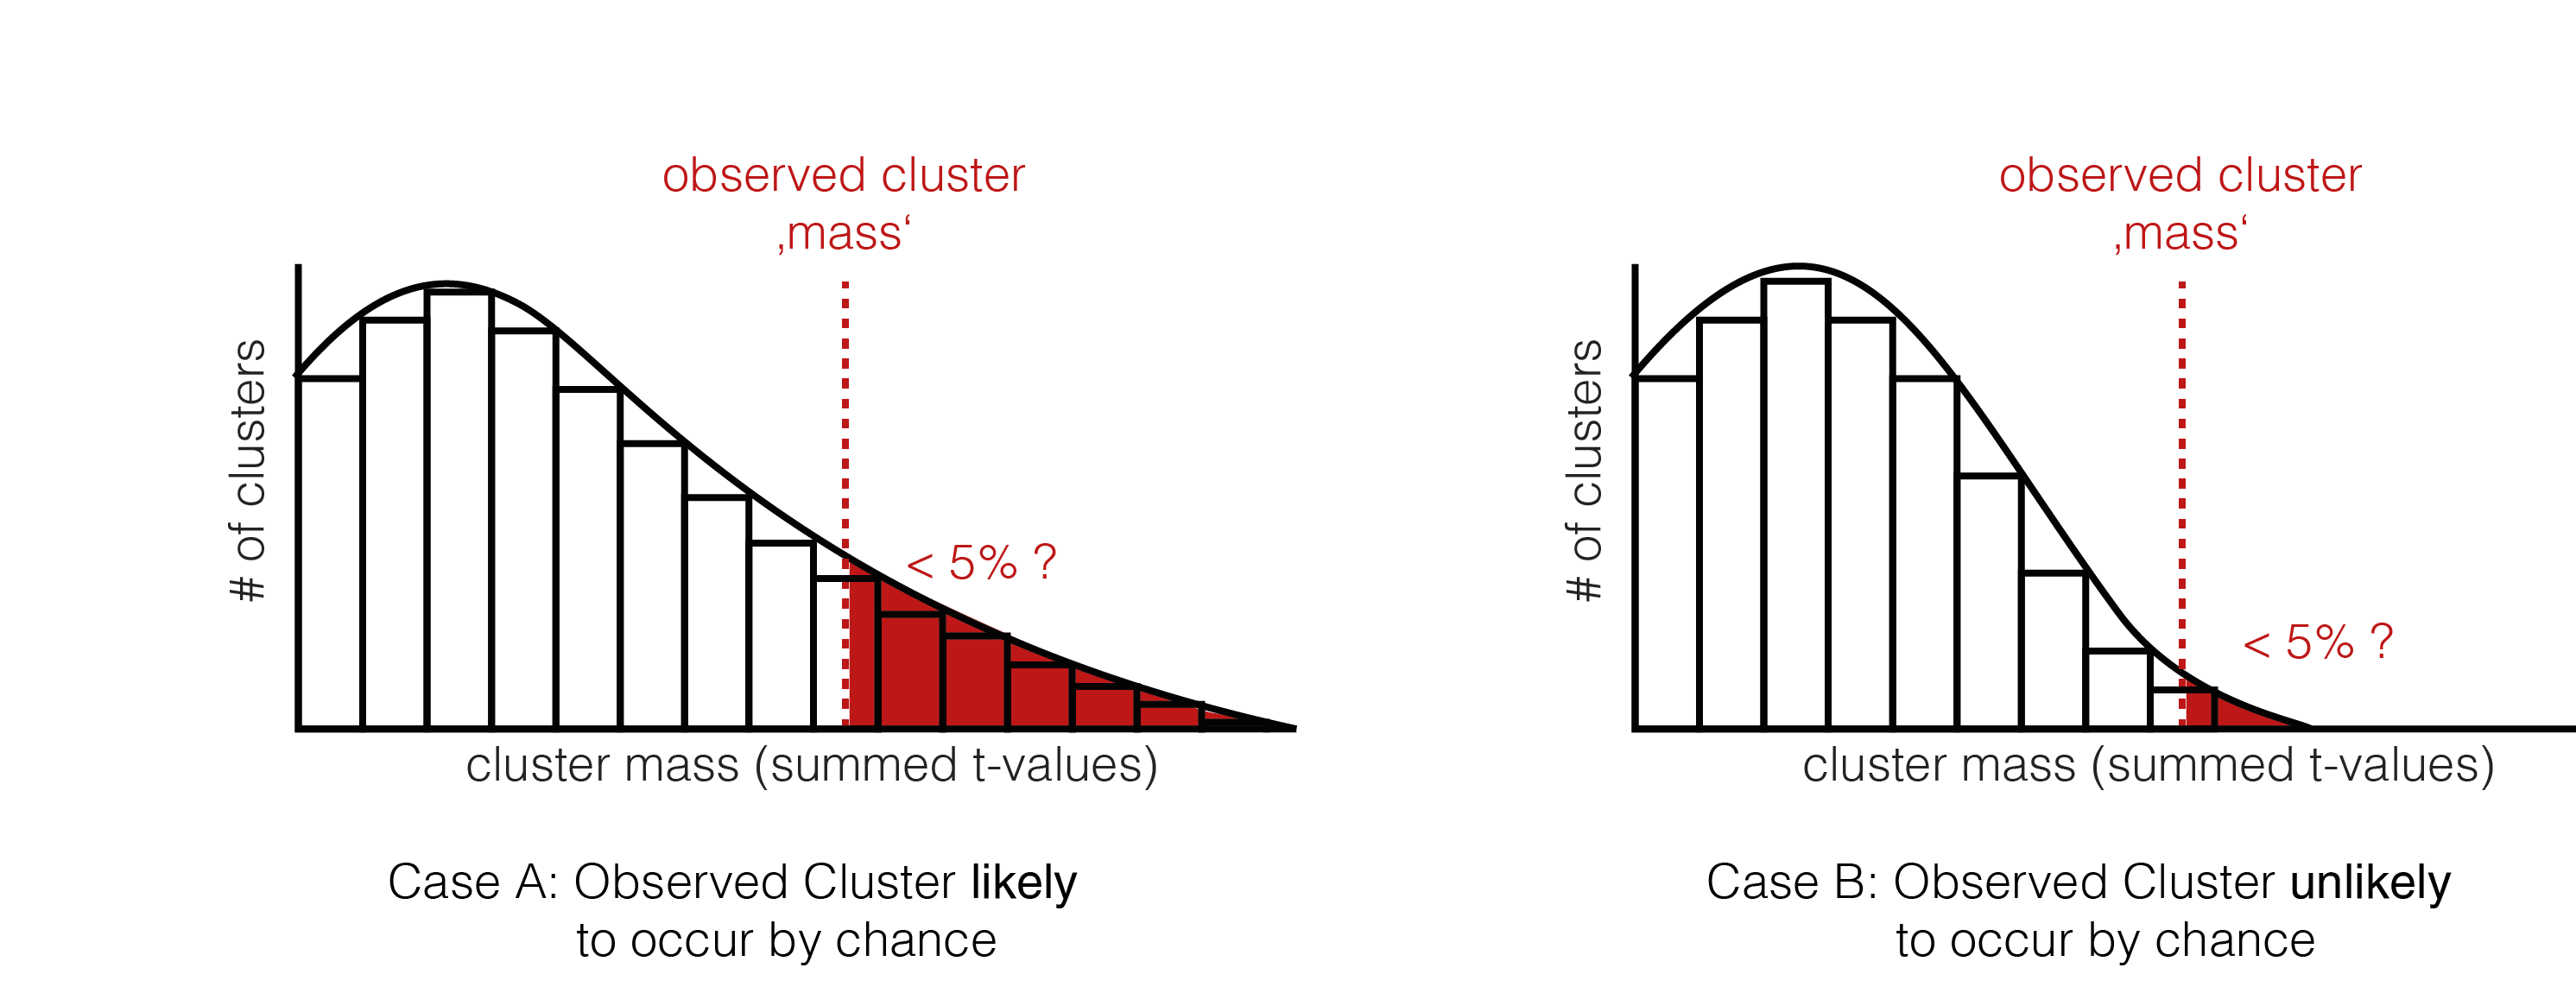
We have two exemplary distributions here: in the left one, we would accept the notion, that the observed cluster mass could have appeared by chance ( p > 0.05). In the second case, we would reject $H_0$, the observed cluster mass is unlikely to come from random chance alone.
And that’s how you do cluster permutation statistics.
For some references, see:
Fieldtrip Cluster Permutation Talk
Fieldtrip FAQ, read this!
Maris: Statistical testing in electrophysiological studies
Maris, Oostenveld: Nonparametric statistical testing of EEG- and MEG-data.
Thanks to Tim C Kietzmann & José Ossandon for teaching me this some (long ;)) time ago. Thanks to Silja Timm for preparing the graphics and Anna Lisa Gert for comments on the text!
Beautiful explanation
Very well done!
Eric Maris
Amazing, Thank You!!!
What is condition here means??? Is it a trial???
Dear Munaza, condition here means experimental condition. If you are interested to perform the statistics over subjects (group-level/2nd-level) then each curve would be the average over many trials for one subject. If you are interested to perform statistics for a single subject, then each curve would be a single trial. Hope that helps
Nice one – used some of your graphics in my teaching today, quite helpful!
[…] including Threshold Free Cluster Enhancement (TFCE). I explained cluster permutation tests in an earlier blog post, which you might want to read before this […]
Thank you very much! A very clear explanation!
Very nice explanation indeed. In a situation where you don’t have two conditions, but instead have one condition and want to test where this condition differs significantly from a particular number over time (say, for example, chance), can the cluster permutation test be used to do this, perhaps involving a one-sample t-test and looking at the cluster-level statistic? Thank you!
Hi John, yes indeed that is possible.
Wow, thank you so much for the quick reply! So in practical terms, what would you do the shuffling with? I.e., if doing against 50% chance would you just create a vector of the number 50 repeated to the same length of your number of subjects and use this for the shuffling? I.e. shuffle whether the condition label for the subject was in the actual condition vector or in the chance vector? If this makes sense? Or would there be a better way? Thank you again!
Sorry somehow I missed your question.
In the case of one sided testing, I think you would typically do random sign flips. That is, under the H0 there is no effect, so whether a subject is above or below 0 is due to chance and you can just flip their signs. Not so under H1
Hello,
I have the same question as John right now, can you elaborate on random sign flips a bit more please: When we compare against chance level, should we use the time series of our experimental group and randomly flip a subset of the values and not flip the others? Or did you mean something totally different?
Hi Ege,
you would flip the whole timeseries / trial, not only some timepoints.
Cheers, Bene
ah, maybe I missunderstood slightly. You would flip a random subset (random per permutation).
The approach is here explained in detail: https://youtu.be/bvcPzBdmfTM?t=2837 (generally the whole video is good)
Thanks for the explanation! I was wondering how to extend permutation clustering to a within-subjects group design with 3 conditions? Is there a special f-test case for permutation clustering? Furthermore, is there a post-hoc test that would typically follow such a procedure?
Yes it is possible by swapping T with F-Test. E.g. in the fieldtrip documentation:
“And if you want to compare more than two experimental conditions, you should choose an F-statistic (‘ft_statfun_indepsamplesF’ or ‘ft_statfun_depsamplesFmultivariate’). ”
Forposthoc tests you could use the t-statistic again. The fieldtrip website has some tutorials & FAQs on this as well
Thank you for this tutorial – I always come back to it when I need to run the test.
I have 2 questions:
1. What if particular permutation doesn’t yield any significant cluster? Do I record it as cluster with size 0 or ignore it altogether?
2. To follow-up on Michael’s question – what if one has many conditions, or wants to use linear mixed effects model that provides t-scores for each main effect and interaction. I have been googling this but without a result – even wrote up this toy example: https://ozika.github.io/perm_test_lme/ No worries if this isn’t usually done, I am just curious as the mixed effects approach seems to offer itself.
Hey,
1) I am actually not sure. Ignoring feels totally wrong. Setting it to 0 seems quite reasonable to me. I’d probably look into the fieldtrip implementation to check what they do. It is generally the best practical reference for cluster-permutation tests I guess.
2) Linear Mixed Effects Models is tough due to many reasons. I’d be happy to discuss! I havent looked at your example yet, but we are currently implementing permutation tests for MixedModels in Julia [more about that sooner than later!]. You could also check out the unfold.jl toolbox with mixed models support (but no permutation testing yet.). I think in general, permutations are relatively easy, as long as you have only one random grouping. But once you get crossed/nested designs with item effects. Things get tricky very quickly.
Hope that helps already!
Best, Bene
Hello Benedikt,
thanks for the great tutorials.
I have a quick question: Is there a reason not to run a cluster based permutation test ond laplace filtered data?
I use the compute_current_source_density function as implemented in mne python. Later defining channel adjacency I can only include EEG channels but not CSD. So I wonder if there is a reason for this?
Best,
Carina
Hey Carina,
this is actually a good question that I do not have a definite answer to. In principle cluster-permutation test is agnostic to the input, as long as you think the activity is spread in clusters over time and space you are good to go. I haven’t used MNE with CSDs yet, not sure what the problem is there. Raising an issue there might geht you help?
I recommend asking this on the fieldtrip maillinglist, especially Eric Maris might now the definite answer to that (if it exist).
PS: Thanks for waiting for my response, I do not get notifications of new comments :>
Was looking for a visualization of the permutation cluster test for a talk – this is perfect, thank you!
Very nice explanation! I was looking for some sort of statistical testing for my multiple time-series data and I am not sure if permutation test would be the right choice. Here is my case : I have EEG data from 5 channels. I divided the data into several non-overlapping windows and compute some metric. Now I want to find out if the temporal variation of this metric over one channel is significantly different than temporal variation of the metric over another channels from the same subject ?
I think cluster permutation tests always make sense as long as you can define what a neighbour is, and as long as it makes sense to assume that the neigbhours will have similar activity. from your description I cannot judge whether this is the case or not.
I also do not know what the performance/behavior of cluster permutation tests are with little data
[…] Short read from Bedikt Ehinger […]