Stretching the axes; visualizing non-linear linear regression
From time to time I explain concepts and ideas to my students.
Background
Often this pops up in a statistical context, when one has a non-linear dependency between the to-be-predicted variable and the predictor-variables. By transforming the predictors, relationships can be made linear, i.e. a logarithmic (exponential, quadratic etc.) relationships can be modeled by a **linear** model.
The idea
I have a very visual understanding on basis-functions / non-linear transformation of variables in terms of stretching / condensing the basis (the x-axis here). This can also be applied to the generalized linear model (here for logistic regression).
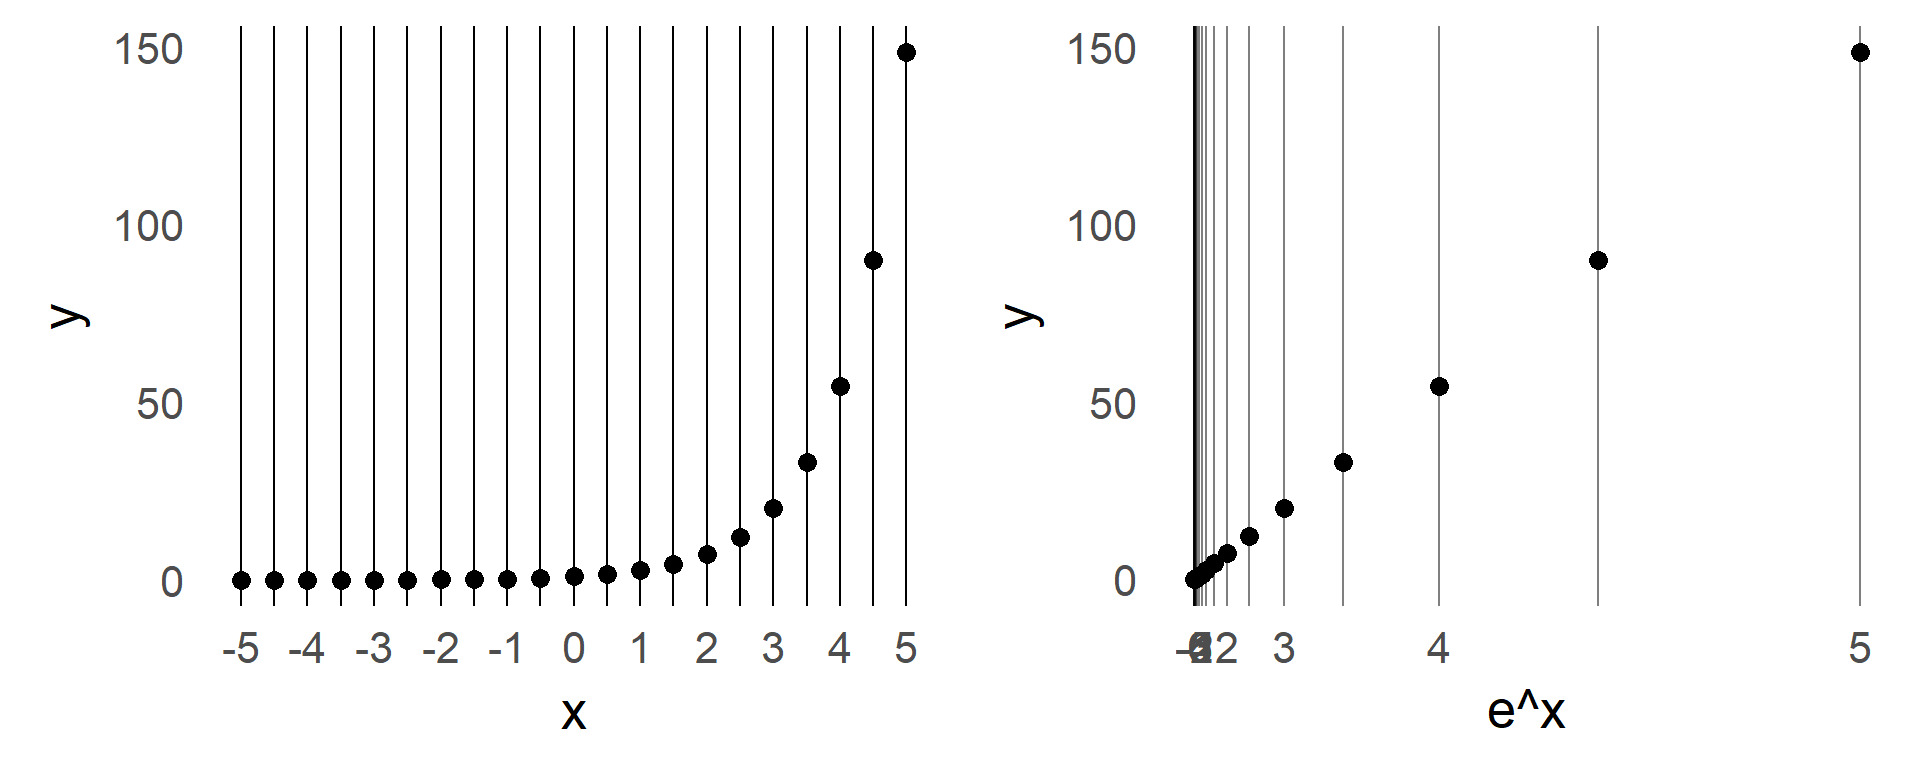
Imagine that the x-axis of a plot is made of some kind of elastic material, you can stretch and condense it. Of course you do not need to stretch every part equally, one example would be to stretch parts that are far away from zero, exponentially more than parts that are close to zero. If you would have an exponential relationship ($ y = e^x$) then $y$ would now lie on a straight line.
TLDR;
Imagine you have a non-linear relationship, by stretching the x-axis in accordance to that non-linear relationship, you will have a linear relationship.
An exemplary non-linear relationship:
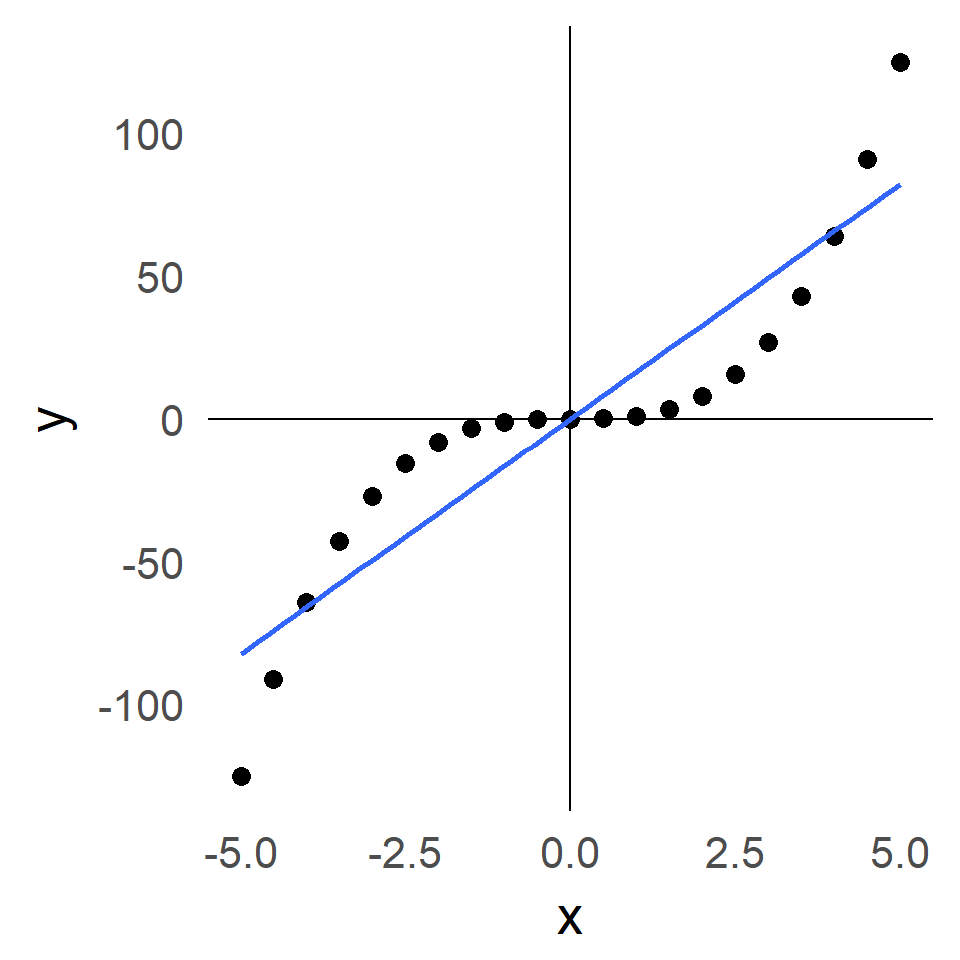
We want to do $y = b_0 + b_1x $ but obviously a linear line does not fit well. We can do something called polynomial expansion, i.e. add more predictors which are simple transformations of the predictor $x$. i.e. $y = b_0 + b_1x + b_2x^2 + b_3x^3$
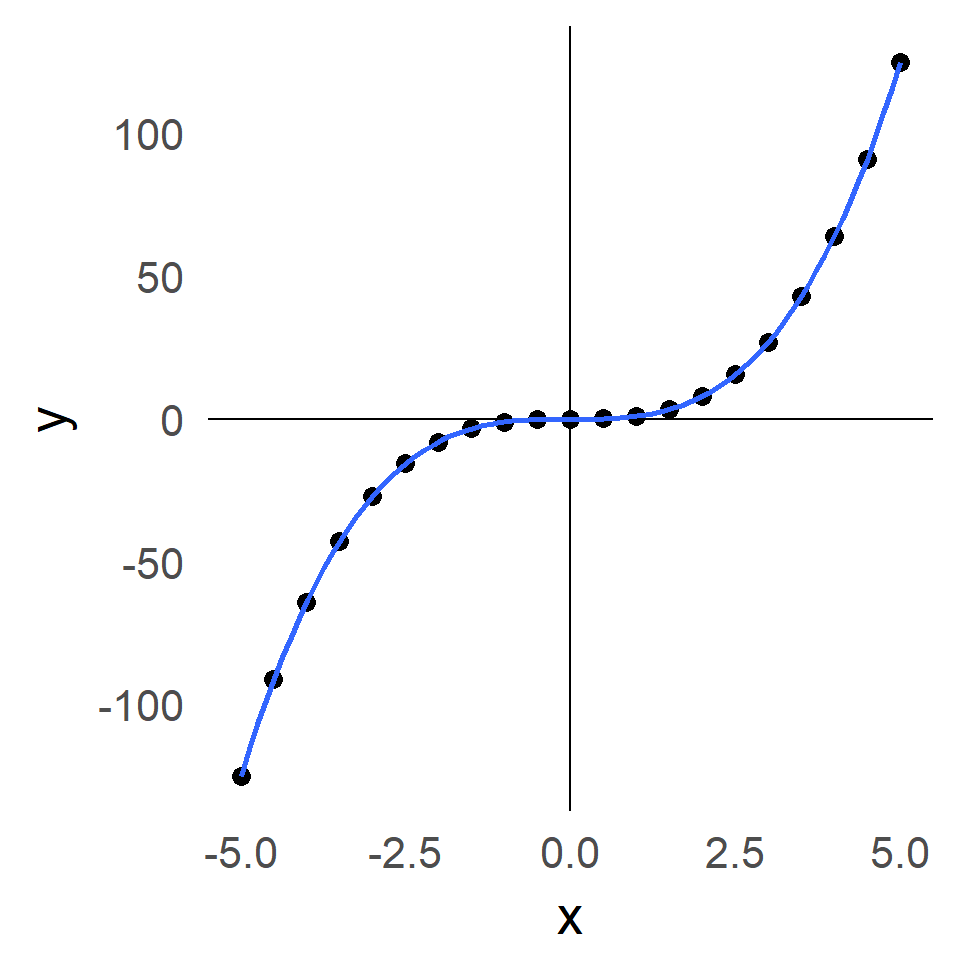
The trick comes here: We can interpret the new $x^3$ basis function as a stretching of the x-axis. I.e. the further we move out on the x-axis, the longer we need to stretch the parts (exactly by x^3 times)
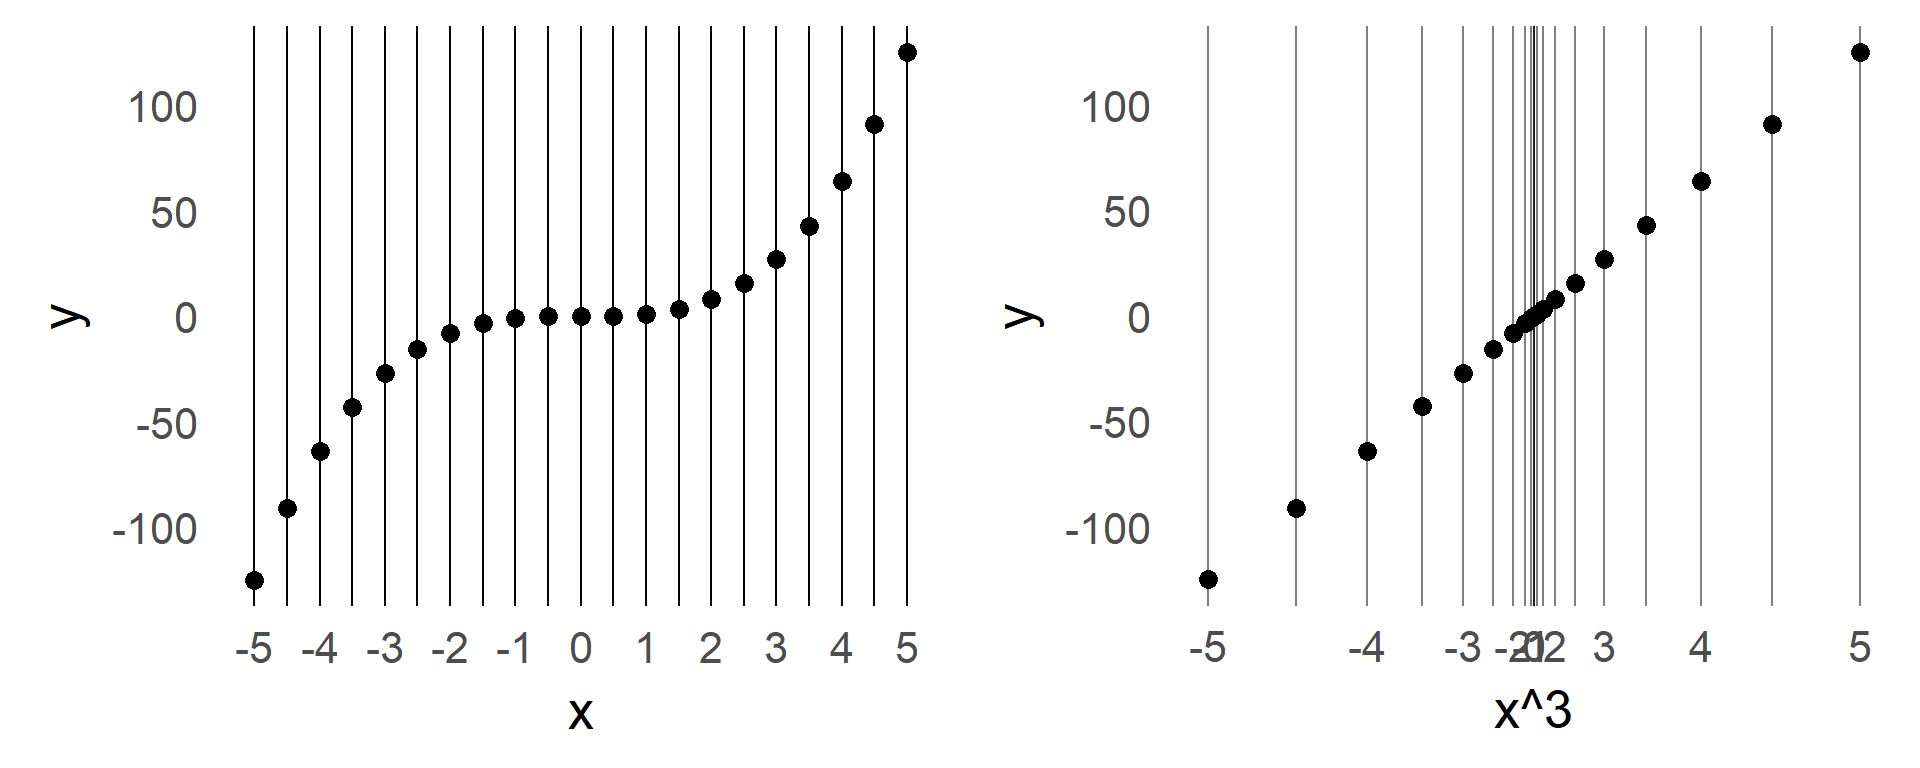
This can be shown also for other functions:
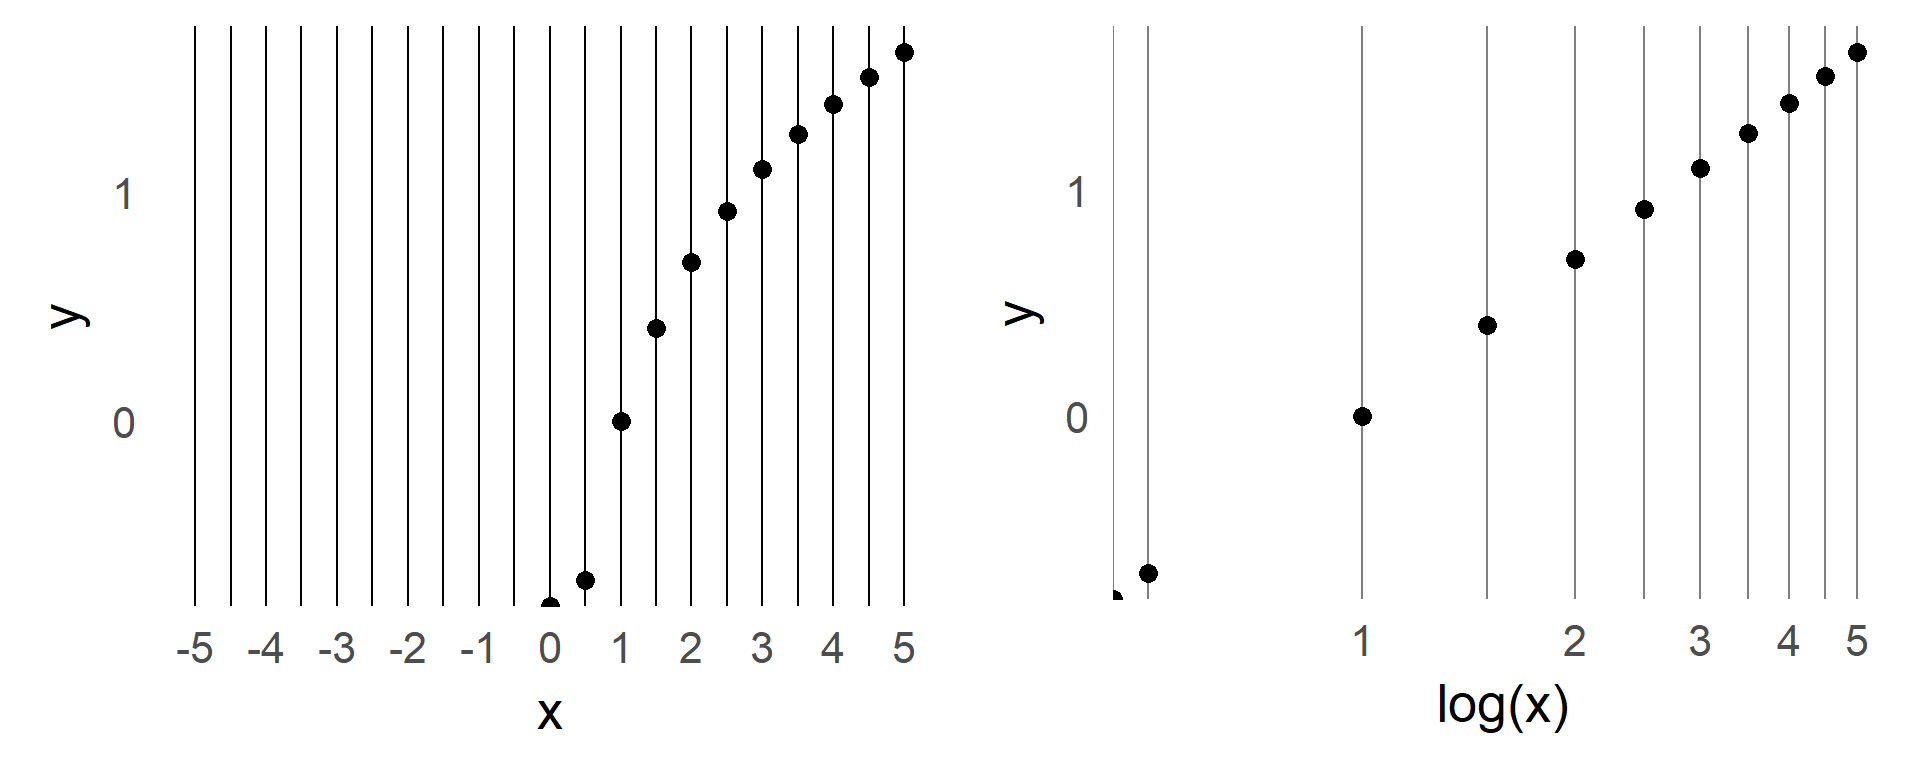
Exponential
Logarithmic
Note that the logarithm is not defined for negative numbers
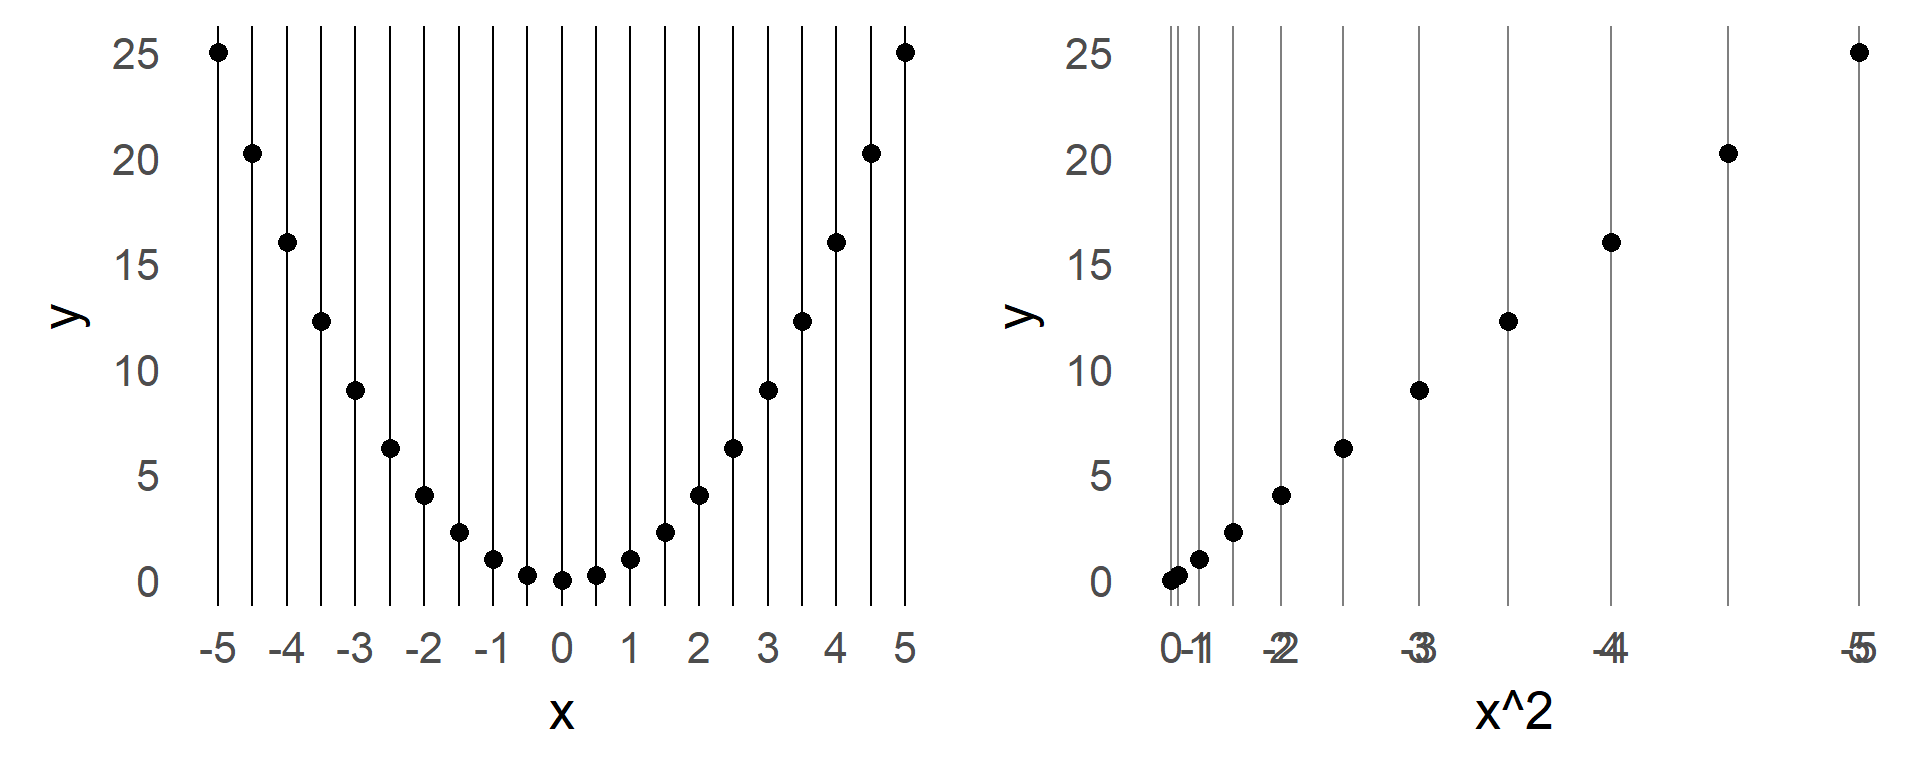
Quadratic
Note how the stretching can be negative, i.e. the original negative values are stretching/transformed to positive values
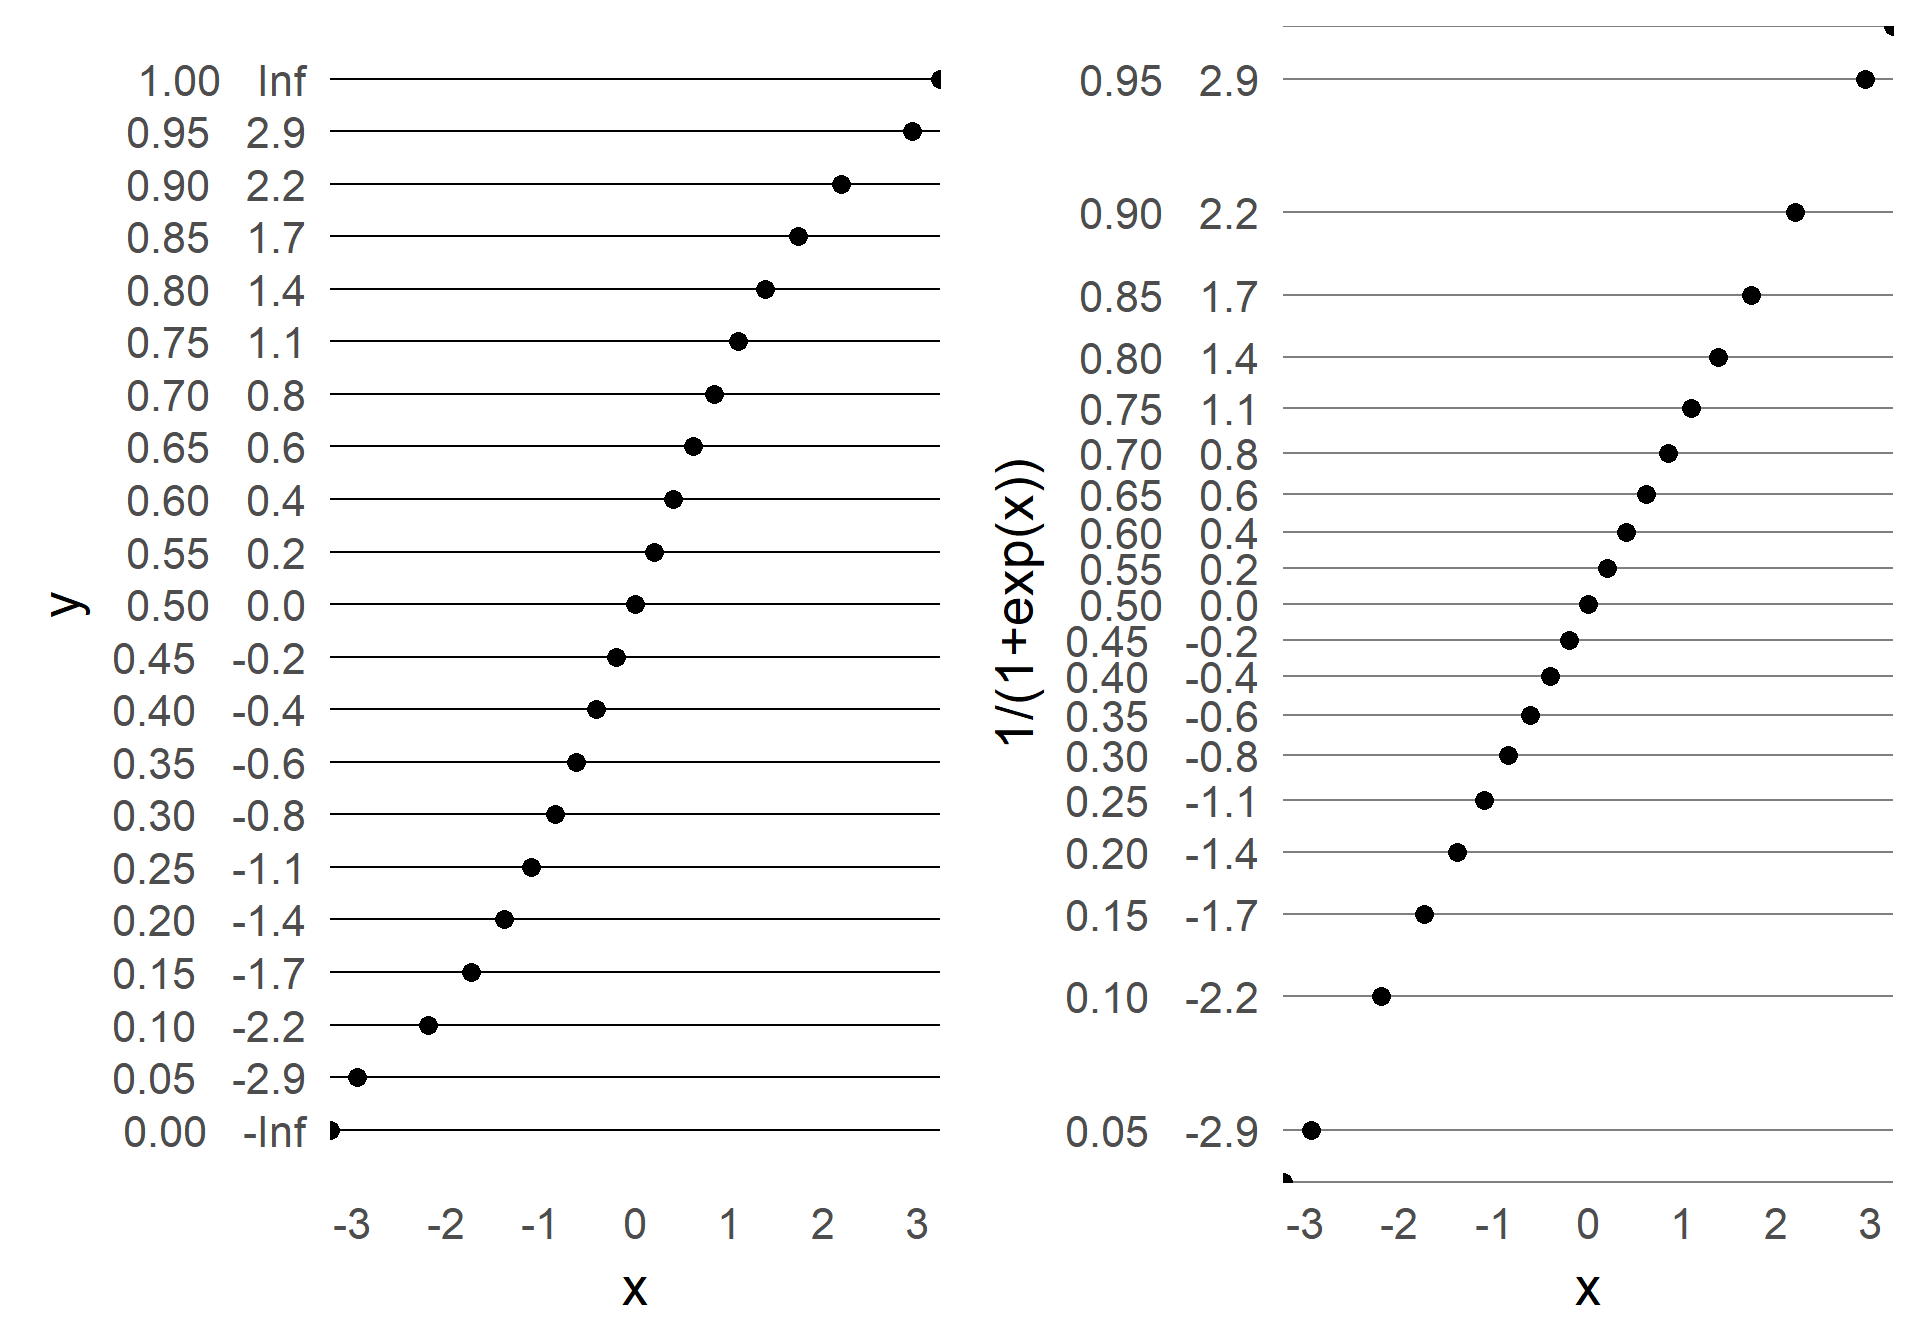
Using the trick on the y-axis
One can interprete **logistic regression** with the same trick:
$$ g{-1}(y) = b_0 + b_1*x <=> y = g(b_0+b_1x)$$
with $g$, the logistic (logit) function and $g^{-1}$ the inverse logistic function (invlogit)
$$ g^{-1} = \ln\frac{p}{1-p} <=> g = \frac{1}{1+e^{-x}}$$
Usually we would have some non-linear dependency on a probabilty of e.g. success. That means, with a low value of x, your success-chance are low. To model this kind of data, one can transform the y-axis using $g$ above.
Hello,
I thank You for those explanations.
I’m on a Data Analyst training. I’m just a beginner on prediction. How can I get the solution to use those models ?
Thank you for your answer.
kind regards.
Brigitte R.
Hello,
it’s my second message: I would like to studdy how to make those non-linear linear regressions.
Please, help me to learn them.
Thank you for your reply.
Brigitte R.
Hi!
I don’t really know what you mean. But probably you should read up on logistic regression. Plenty of packages out there in all programming languages, and even more tutorials 🙂
Cheers, Bene