Why Robust Statistics?
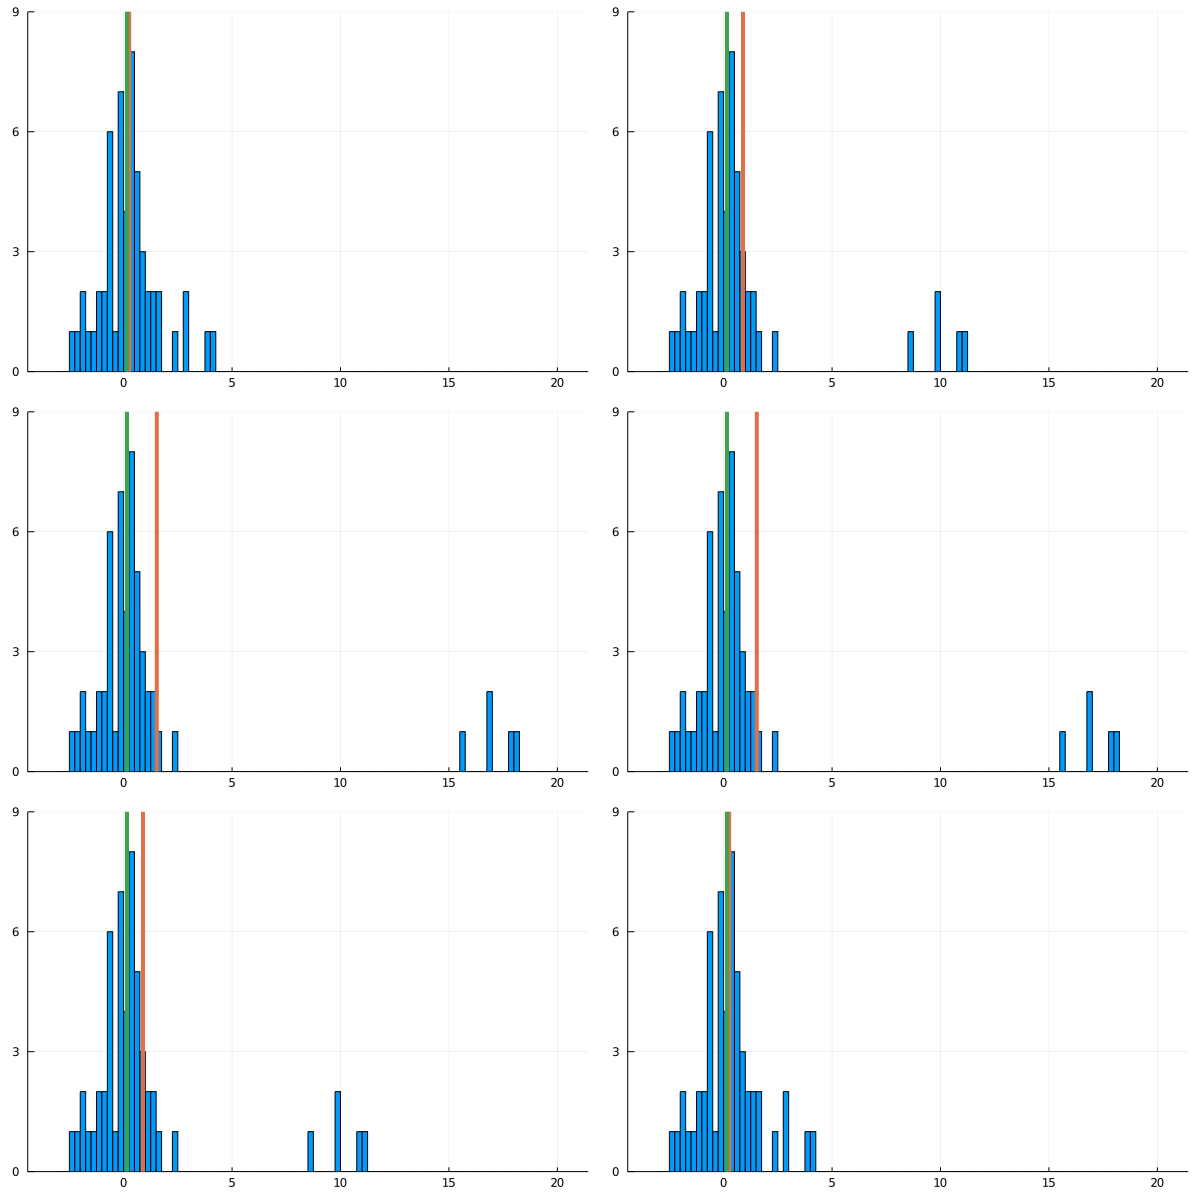
For my new EEG course in Stuttgart I spend some time to make this gif – I couldn’t find a version online. It shows a simple fact: If you calculate the mean, the breakdown point of 0%. That is, every datapoint counts whether it is an outlier or not.
Trimmed or winsorized means instead calculate the mean based on the inner X % (e.g. inner 80% for trimmed mean of 20%, removing the top and bottom 10% of datapoints) – or in case of winsorizing the mean with the 20% extreme values not removed, but changed to the now new remaining limits). Therefore they have breaking points of X% too – making them robust to outliers.
Fun fact: a 100% trimmed mean is just the median!

As you can see, increasing the amount of outliers has a clear influence on the mean but not the 20% trimmed mean.
One important point: While sometimes outlier removal and robust statistics are very important, and arguable a better default (compared to mean) – you should also always try to understand where the outliers you remove actually come from.
The source code to generate the animation is here:
using Plots
using Random
using StatsBase

anim = @animate  for i ∈ [range(3,20,step=0.5)...,range(20,3,step=-0.5)...]
    Random.seed!(1);

    x = randn(50);
    append!(x,randn(5) .+ i); #add the offset

    histogram(x,bins=range(-3,20,step=0.25),ylims=(0,9.),legend=false)

    vline!([mean(x)],linewidth=4.)
    vline!([mean(trim(x,prop=0.2))],linewidth=4.)
    #vline!([mean(winsor(x,prop=0.2))])# same as trimmean in this example

end
gif(anim, "outlier_animation.gif", fps = 4)
Very nice demo. You have to differentiate whether outliers are measurement artifacts (e.g. the fridge next doors started and induced a power surge) or the variable of interest in non-Gaussian distributed (e.g. reaction times). In the first case you just want to get rid of the respective data points. In the second case robust statistics of some type is asked for.
Very useful message